Trade at a Glance 2013
Australia's major goods & services exports 2012(a)
| Rank | Commodity | $ billion |
|---|---|---|
| 1 | Iron ores & concentrates | 54.4 |
| 2 | Coal | 41.3 |
| 3 | Gold | 15.5 |
| 4 | Education-related travel services | 14.5 |
| 5 | Natural gas | 13.4 |
| 6 | Personal travel (excl education) services | 12.2 |
| 7 | Crude petroleum | 11.0 |
| 8 | Wheat | 6.5 |
| 9 | Aluminium ores & concentrates (incl alumina) | 5.3 |
| 10 | Copper ores & concentrates | 5.3 |
| 11 | Beef | 4.8 |
| 12 | Business travel services | 4.1 |
| 13 | Medicaments (incl veterinary) | 3.8 |
| 14 | Professional services | 3.8 |
| 15 | Aluminium | 3.8 |
| 16 | Technical & other business services | 3.5 |
| 17 | Copper | 3.3 |
| 18 | Refined petroleum | 3.3 |
| 19 | Cotton | 2.6 |
| 20 | Wool & other animal hair (incl tops) | 2.5 |
| Total exports(b) | 300.4 |
(a) Goods trade is on a recorded trade basis. Services trade is on a balance of payments basis.
(b) Total exports on a balance of payments basis.
Based on ABS trade data on DFAT STARS database and ABS catalogue 5368.0.
Australia's major goods & services imports 2012(a)
| Rank | Commodity | $ billion |
|---|---|---|
| 1 | Personal travel (excl education) services | 22.1 |
| 2 | Crude petroleum | 21.6 |
| 3 | Passenger motor vehicles | 16.9 |
| 4 | Refined petroleum | 15.9 |
| 5 | Freight transport services | 9.2 |
| 6 | Telecom equipment & parts | 8.7 |
| 7 | Goods vehicles | 8.6 |
| 8 | Medicaments (incl veterinary) | 8.2 |
| 9 |
Passenger transport services(b) |
6.9 |
| 10 | Civil engineering equipment & parts | 6.8 |
| 11 | Computers | 6.8 |
| 12 | Gold | 5.8 |
| 13 | Technical & other business services | 5.0 |
| 14 | Charges for intellectual property | 4.0 |
| 15 | Professional services | 3.5 |
| 16 | Business travel services | 3.4 |
| 17 | Rubber tyres, treads & tubes | 3.1 |
| 18 | Measuring & analysing instruments | 3.0 |
| 19 | Vehicle parts & accessories | 2.9 |
| 20 | Furniture, mattresses & cushions | 2.9 |
| Total imports(c) | 323.4 |
(a) Goods trade is on a recorded trade basis. Services trade is on a balance of payments basis.
(b) Includes related agency fees & commissions.
(c) Total imports on a balance of payments basis.
Based on ABS trade data on DFAT STARS database and ABS catalogue 5368.0.
Australia's major goods exports 2012(a)
| Rank | Commodity | $ million | % share |
|---|---|---|---|
| 1 | Iron ores & concentrates | 54,447 | 21.8 |
| 2 | Coal | 41,273 | 16.6 |
| 3 | Gold | 15,526 | 6.2 |
| 4 | Natural gas | 13,416 | 5.4 |
| 5 | Crude petroleum | 10,988 | 4.4 |
| 6 | Wheat | 6,531 | 2.6 |
| 7 | Aluminium ores & concentrates (incl alumina) | 5,273 | 2.1 |
| 8 | Copper ores & concentrates | 5,255 | 2.1 |
| 9 | Beef | 4,754 | 1.9 |
| 10 | Medicaments (incl veterinary) | 3,849 | 1.5 |
| 11 | Aluminium | 3,774 | 1.5 |
| 12 | Copper | 3,349 | 1.3 |
| 13 | Refined petroleum | 3,271 | 1.3 |
| 14 | Cotton | 2,626 | 1.1 |
| 15 | Wool & other animal hair (incl tops) | 2,524 | 1.0 |
| 16 | Meat (excl beef) | 2,370 | 1.0 |
| 17 | Alcoholic beverages (mainly wine) | 2,009 | 0.8 |
| 18 | Oil-seeds & oleaginous fruits, soft | 1,780 | 0.7 |
| 19 | Passenger motor vehicles | 1,697 | 0.7 |
| 20 | Nickel ores & concentrates | 1,478 | 0.6 |
| Total goods exports(b) | 249,233 | 100.0 |
(a) Recorded trade basis.
(b) Total goods exports on a balance of payments basis.
Based on ABS trade data on DFAT STARS database and ABS catalogue 5368.0.
Australia's major goods imports 2012(a)
| Rank | Commodity | $ million | % share |
|---|---|---|---|
| 1 | Crude petroleum | 21,567 | 8.3 |
| 2 | Passenger motor vehicles | 16,919 | 6.5 |
| 3 | Refined petroleum | 15,871 | 6.1 |
| 4 | Telecom equipment & parts | 8,746 | 3.4 |
| 5 | Goods vehicles | 8,562 | 3.3 |
| 6 | Medicaments (incl veterinary) | 8,201 | 3.1 |
| 7 | Civil engineering equipment & parts | 6,822 | 2.6 |
| 8 | Computers | 6,777 | 2.6 |
| 9 | Gold | 5,841 | 2.2 |
| 10 | Rubber tyres, treads & tubes | 3,053 | 1.2 |
| 11 | Measuring & analysing instruments | 2,950 | 1.1 |
| 12 | Vehicle parts & accessories | 2,932 | 1.1 |
| 13 | Furniture, mattresses & cushions | 2,905 | 1.1 |
| 14 | Electrical machinery & parts | 2,608 | 1.0 |
| 15 | Mechanical handling equipment & parts | 2,541 | 1.0 |
| 16 | Specialised machinery & parts | 2,458 | 0.9 |
| 17 | Pumps (excl liquid pumps) & parts | 2,418 | 0.9 |
| 18 | Prams, toys, games & sporting goods | 2,316 | 0.9 |
| 19 | Pharmaceutical products (excl medicaments) | 2,305 | 0.9 |
| 20 | Household-type equipment | 2,273 | 0.9 |
| Total goods imports(b) | 260,997 | 100.0 |
(a) Recorded trade basis.
(b) Total goods imports on a balance of payments basis.
Based on ABS trade data on DFAT STARS database and ABS catalogue 5368.0.
Australia's services exports 2012(a)
| Services | $ million | % share |
|---|---|---|
| Manufactured services on physical inputs owned by others | 10 | 0.0 |
| Maintenance & repair | 50 | 0.1 |
| Transport | ||
| Passenger(b) | 2,490 | 4.9 |
| Freight | 348 | 0.7 |
| Other | 2,286 | 4.5 |
| Postal & courier services | 1,040 | 2.0 |
| Total transport | 6,164 | 12.0 |
| Travel | ||
| Business | 4,102 | 8.0 |
| Personal | 26,640 | 52.0 |
| > Education-related | 14,467 | 28.3 |
| > Other personal(c) | 12,173 | 23.8 |
| Total travel | 30,742 | 60.1 |
| Other | ||
| Construction | 50 | 0.1 |
| Insurance & pension | 457 | 0.9 |
| Financial | 1,596 | 3.1 |
| Intellectual property charges | 831 | 1.6 |
| Telecommunications, computer & information | 1,668 | 3.3 |
| Other business services | 7,824 | 15.3 |
| Personal, cultural and recreational | 878 | 1.7 |
| Government services | 912 | 1.8 |
| Total other | 14,216 | 27.8 |
| Total services exports | 51,182 | 100.0 |
(a) Balance of payments basis.
(b) Passenger services include air transport-related agency fees & commissions.
(c) Inbound tourism for mainly recreational purposes.
Based on ABS catalogue 5368.0.
Australia's services imports 2012(a)
| Services | $ million | % share |
|---|---|---|
|
Manufactured services on physical inputs owned by others |
0 | 0.0 |
| Maintenance & repair | 493 | 0.8 |
| Transport | ||
|
Passenger(b) |
6,901 | 11.1 |
| Freight | 9,228 | 14.8 |
| Other | 480 | 0.8 |
| Postal & courier services | 79 | 0.1 |
| Total transport | 16,688 | 26.7 |
| Travel | ||
| Business | 3,386 | 5.4 |
| Personal | 23,152 | 37.1 |
| > Education-related | 1,020 | 1.6 |
| > Other personal(c) | 22,132 | 35.5 |
| Total travel | 26,538 | 42.5 |
| Other | ||
| Construction | 0 | 0.0 |
| Insurance & pension | 714 | 1.1 |
| Financial | 777 | 1.2 |
| Intellectual property charges | 4,044 | 6.5 |
| Telecommunications, computer & information | 1,790 | 2.9 |
| Other business services | 8,782 | 14.1 |
| Personal, cultural and recreational | 1,623 | 2.6 |
| Government services | 968 | 1.6 |
| Total other | 18,698 | 30.0 |
| Total services imports | 62,417 | 100.0 |
(a) Balance of payments basis.
(b) Passenger services include air transport-related agency fees & commissions.
(c) Outbound tourism for mainly recreational purposes.
Based on ABS catalogue 5368.0.
Australia's global export position
How we compare to the rest of the world 2012 (US$ billion)
| Rank | Country | Goods(a) | Services(b) | Total exports | % share |
|---|---|---|---|---|---|
| 1 | China | 2,049 | 191 | 2,240 | 9.8 |
| 2 | United States | 1,546 | 640 | 2,186 | 9.6 |
| 3 | Germany | 1,407 | 262 | 1,669 | 7.3 |
| 4 | Japan | 799 | 146 | 944 | 4.1 |
| 5 | Netherlands | 656 | 134 | 789 | 3.5 |
| 6 | France | 569 | 212 | 780 | 3.4 |
| 7 | United Kingdom | 474 | 284 | 758 | 3.3 |
| 8 | Republic of Korea | 548 | 111 | 659 | 2.9 |
| 9 | Hong Kong(c) | 493 | 123 | 616 | 2.7 |
| 10 | Italy | 501 | 104 | 605 | 2.7 |
| 11 | Russian Federation | 529 | 59 | 588 | 2.6 |
| 12 | Belgium | 447 | 97 | 543 | 2.4 |
| 13 | Canada | 455 | 79 | 534 | 2.3 |
| 14 | Singapore | 408 | 112 | 521 | 2.3 |
| 15 | India | 294 | 141 | 435 | 1.9 |
| 16 | Spain | 294 | 137 | 431 | 1.9 |
| 17 | Saudi Arabia | 388 | 11 | 399 | 1.7 |
| 18 | Mexico | 371 | 16 | 387 | 1.7 |
| 19 | United Arab Emirates | 350 | 15 | 365 | 1.6 |
| 20 | Taiwan | 301 | 49 | 350 | 1.5 |
| 21 | Switzerland | 226 | 93 | 319 | 1.4 |
| 22 | Australia | 258 | 53 | 311 | 1.4 |
| 23 | Brazil | 243 | 40 | 282 | 1.2 |
| 24 | Thailand | 230 | 50 | 279 | 1.2 |
| 25 | Malaysia | 227 | 38 | 265 | 1.2 |
| 26 | Sweden | 172 | 76 | 249 | 1.1 |
| 27 | Ireland | 117 | 116 | 233 | 1.0 |
| 28 | Austria | 166 | 61 | 228 | 1.0 |
| 29 | Poland | 183 | 38 | 221 | 1.0 |
| 30 | Indonesia | 188 | 23 | 212 | 0.9 |
| Total exports | 18,401 | 4,426 | 22,827 | ||
(a) Goods on recorded trade basis.
(b) Services on balance of payments basis.
(c) Special Administrative Region of China.
Source: WTO online database.
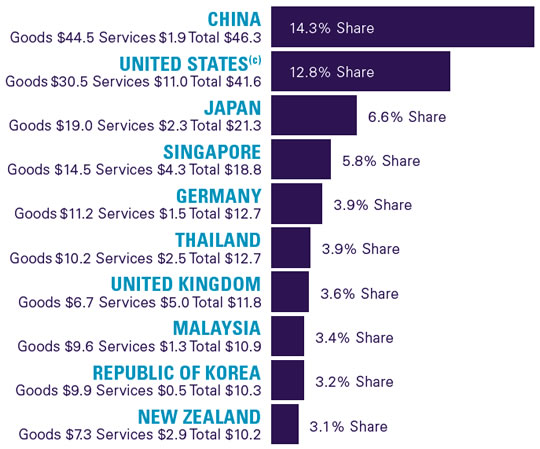
Australia's top 10 export Markets 2012(a)
($ billion)

(a) All data is on a balance of payments basis, except for goods by country which are on a recorded trade basis.
Based on ABS trade data on DFAT STARS database and ABS catalogue 5368.0.55.004.
Australia's global import position
How we compare to the rest of the world 2012 (US$ billion)
| Rank | Country | Goods(a) | Services(b) | Total imports | % share |
|---|---|---|---|---|---|
| 1 | United States | 2,336 | 442 | 2,777 | 12.1 |
| 2 | China | 1,818 | 281 | 2,100 | 9.2 |
| 3 | Germany | 1,167 | 295 | 1,462 | 6.4 |
| 4 | Japan | 886 | 177 | 1,062 | 4.6 |
| 5 | United Kingdom | 690 | 180 | 870 | 3.8 |
| 6 | France | 674 | 173 | 846 | 3.7 |
| 7 | Netherlands | 591 | 120 | 711 | 3.1 |
| 8 | Republic of Korea | 520 | 108 | 628 | 2.7 |
| 9 | India | 490 | 128 | 618 | 2.7 |
| 10 | Hong Kong(c) | 553 | 57 | 611 | 2.7 |
| 11 | Italy | 487 | 107 | 593 | 2.6 |
| 12 | Canada | 475 | 106 | 581 | 2.5 |
| 13 | Belgium | 437 | 92 | 530 | 2.3 |
| 14 | Singapore | 380 | 118 | 498 | 2.2 |
| 15 | Russian Federation | 335 | 106 | 442 | 1.9 |
| 16 | Spain | 335 | 90 | 424 | 1.9 |
| 17 | Mexico | 380 | 29 | 410 | 1.8 |
| 18 | Australia | 270 | 65 | 335 | 1.5 |
| 19 | Brazil | 233 | 81 | 314 | 1.4 |
| 20 | Taiwan | 270 | 43 | 313 | 1.4 |
| 21 | Thailand | 248 | 53 | 300 | 1.3 |
| 22 | United Arab Emirates | 230 | 64 | 294 | 1.3 |
| 23 | Turkey | 237 | 21 | 257 | 1.1 |
| 24 | Switzerland | 198 | 47 | 245 | 1.1 |
| 25 | Malaysia | 197 | 42 | 239 | 1.0 |
| 26 | Saudi Arabia | 156 | 73 | 229 | 1.0 |
| 27 | Poland | 196 | 32 | 228 | 1.0 |
| 28 | Indonesia | 190 | 34 | 224 | 1.0 |
| 29 | Austria | 178 | 43 | 221 | 1.0 |
| 30 | Sweden | 163 | 55 | 218 | 1.0 |
| Total imports | 18,601 | 4,274 | 22,875 | ||
(a) Goods on recorded trade basis.
(b) Services on balance of payments basis.
(c) Special Administrative Region of China.
Source: WTO online database.
Australia's top 10 import sources 2012(a)(b)
($ billion)
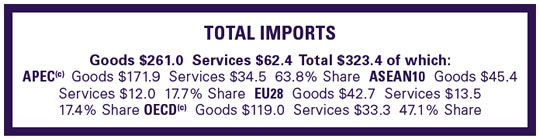
(a) All data is on a balance of payments basis, except for goods by country which are on a recorded trade basis.
(b) Excludes imports of aircraft (excl the United States - see footnote (c)). This has a significant impact on import totals for France (EU28).
(c) Includes confidential aircraft imports for the US only.
Based on ABS trade data on DFAT STARS database and ABS catalogue 5368.0.55.004.
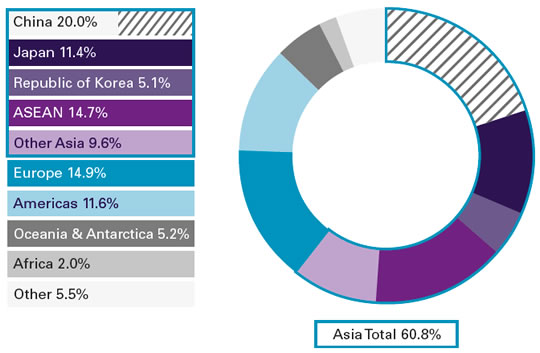
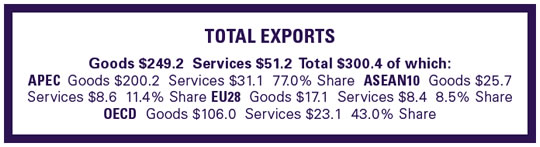
Top 10 two-way trading partners 2012(a)(b)
($ billion)
| RANK | Country | Goods | Services | Total | % share | |
|---|---|---|---|---|---|---|
| 1 | China | 117.4 | 7.6 | 125.1 | 20.0 | |
| 2 | Japan | 66.8 | 4.2 | 71.1 | 11.4 | |
| 3 |
United States(c) |
39.9 | 16.3 | 56.2 | 9.0 | |
| 4 | Republic of Korea | 29.7 | 2.2 | 31.9 | 5.1 | |
| 5 | Singapore | 21.6 | 7.5 | 29.1 | 4.7 | |
| 6 | United Kingdom | 13.4 | 8.9 | 22.3 | 3.6 | |
| 7 | New Zealand | 14.7 | 6.6 | 21.2 | 3.4 | |
| 8 | Thailand | 15.1 | 3.4 | 18.4 | 3.0 | |
| 9 | Malaysia | 14.7 | 2.9 | 17.7 | 2.8 | |
| 10 | India | 14.8 | 2.7 | 17.5 | 2.8 | |
| Total top 10 trading partners |
348.1 | 62.3 | 410.4 | 65.8 | ||
| Total two-way trade | 510.2 | 113.6 | 623.8 | 100.0 | ||
| of which: |
APEC(c) |
372.1 | 65.6 | 437.8 | 70.2 | |
| ASEAN10 | 71.1 | 20.5 | 91.7 | 14.7 | ||
|
EU28(b) |
59.7 | 21.9 | 81.6 | 13.1 | ||
|
OECD(c) |
224.9 | 56.4 | 281.3 | 45.1 | ||
(a) All data is on a balance of payments basis, except for goods by country which are on a recorded trade basis.
(b) Excludes imports of aircraft (excl the United States - see footnote (c)). This has a significant impact on import totals for France (EU28).
(c) Includes confidential aircraft imports for the US only.
Based on ABS trade data on DFAT STARS database, ABS catalogue 5368.0.05.004 and ABS unpublished data.
Total two-way trade by region 2012