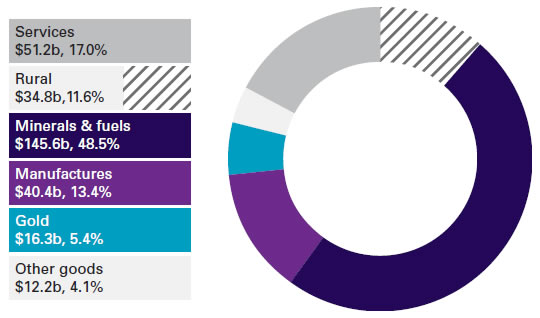
Australia's trade in goods and services reached a new high in 2012. Two-way trade grew by 1.5 per cent to $623.8 billion in 2012, up from $614.5 billion in 2011. Minerals and fuels, especially iron ore and coal, played a vital role in Australia's economic success, making up nearly half of the nation's exports.
China, Japan, the United States and the Republic of Korea were Australia's top four trading partners again in 2012. Trade largely focused on the Asia-Pacific region, with over 70 per cent taking place with member economies of the Asia-Pacific Economic Cooperation (APEC) group.
By Sector – Australia's Exports
Australia's total goods and services exports fell 4 per cent to $300.4 billion, receding slightly from a record high in 2011. Export volumes grew 6.7 per cent while export prices fell 10.2 per cent.
Australia's manufacturing exports decreased by 3.1 per cent to $40.4 billion, due in part to the strength of the Australian dollar. Services exports reached $51.2 billion in 2012, with travel services accounting for 60 per cent.
Exports of goods and services 2012(a)
Share by sector
(a) Balance of payments basis. Based on ABS catalogue 5368.0.
By Sector – Australia's Imports
Imports are integral to the success of the Australian economy, providing crucial inputs to domestic industries and helping to maintain a robust, competitive economy.
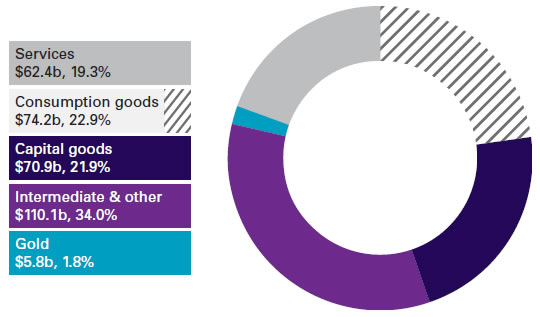
Australia's total goods and services imports rose 7.3 per cent to $323.4 billion. Import volumes grew 6.8 per cent while import prices rose 0.6 per cent.
Intermediate and other goods (e.g. car components) accounted for over a third of total imports, valued at $110.1 billion, while consumption goods, capital goods and services accounted for around 20 per cent each.
Imports of goods and services 2012(a)
Share by sector
(a) Balance of payments basis. Based on ABS catalogue 5368.0.


