
Australia's major goods & services exports 2014 (a)
| Rank | Commodity | $ billion |
|---|---|---|
| 1 | Iron ores & concentrates | 66.0 |
| 2 | Coal | 38.0 |
| 3 | Natural gas | 17.7 |
| 4 | Education-related travel services (b) | 17.0 |
| 5 | Personal travel (excl education) services | 14.2 |
| 6 | Gold | 13.5 |
| 7 | Crude petroleum | 10.6 |
| 8 | Beef | 7.8 |
| 9 | Aluminium ores & concentrates (incl alumina) | 6.3 |
| 10 | Wheat | 5.9 |
| 11 | Copper ores & concentrates | 5.4 |
| 12 | Professional services | 4.8 |
| 13 | Other ores & concentrates (c) | 4.6 |
| 14 | Business travel services | 4.3 |
| 15 | Aluminium | 4.0 |
| 16 | Copper | 3.8 |
| 17 | Meat (excl beef) | 3.7 |
| 18 | Technical & other business services | 3.3 |
| 19 | Financial services | 3.3 |
| 20 | Refined petroleum | 2.8 |
| Total exports (d) | 326.9 |
(a) Goods trade is on a recorded trade basis. Services trade is on a balance of payments basis.
(b) Includes student expenditure on tuition fees and living expenses.
(c) Mainly consists of Zinc ores & concentrates, Manganese ores & concentrates and Lead ores & concentrates.
(d) Total exports on a balance of payments basis.
Based on ABS trade data on DFAT STARS database and ABS catalogue 5302.0.
Australia's major goods & services imports 2014 (a) (b)
| Rank | Commodity | $ billion |
|---|---|---|
| 1 | Personal travel (excl education) services | 24.6 |
| 2 | Crude petroleum | 20.0 |
| 3 | Refined petroleum | 18.6 |
| 4 | Passenger motor vehicles | 17.6 |
| 5 | Telecom equipment & parts | 9.8 |
| 6 | Freight transport services | 9.7 |
| 7 | Medicaments (incl veterinary) | 7.5 |
| 8 | Computers | 7.3 |
| 9 | Passenger transport services (c) | 6.1 |
| 10 | Goods vehicles | 6.0 |
| 11 | Technical & other business services | 5.7 |
| 12 | Professional services | 4.7 |
| 13 | Charges for intellectual property | 4.5 |
| 14 | Heating & cooling equipment & parts | 4.2 |
| 15 | Gold | 4.0 |
| 16 | Pumps (excl liquid pumps) & parts | 3.9 |
| 17 | Furniture, mattresses & cushions | 3.6 |
| 18 | Business travel services | 3.4 |
| 19 | Measuring & analysing instruments | 3.2 |
| 20 | Electrical machinery & parts | 3.0 |
| Total imports (d) | 337.0 |
(a) Goods trade is on a recorded trade basis. Services trade is on a balance of payments basis.
(b) Please note–imports of aircraft were made confidential by the ABS from Sept 2008 onwards. Imports of aircraft would rank in Australia's top 20 imports. DFAT estimates that aircraft imports were valued at around $3.8 billion in 2014.
(c) Includes Related agency fees & commissions.
(d) Total imports on a balance of payments basis.
Based on ABS trade data on DFAT STARS database and ABS catalogue 5302.0.
Australia's major goods exports 2014 (a) (b)
| Rank | Commodity | $ million | % share |
|---|---|---|---|
| 1 | Iron ores & concentrates | 66,008 | 24.7 |
| 2 | Coal | 37,999 | 14.2 |
| 3 | Natural gas | 17,743 | 6.7 |
| 4 | Gold | 13,460 | 5.0 |
| 5 | Crude petroleum | 10,564 | 4.0 |
| 6 | Beef | 7,751 | 2.9 |
| 7 | Aluminium ores & concentrates (incl alumina) | 6,336 | 2.4 |
| 8 | Wheat | 5,920 | 2.2 |
| 9 | Copper ores & concentrates | 5,359 | 2.0 |
| 10 | Other ores & concentrates (c) | 4,594 | 1.7 |
| 11 | Aluminium | 3,968 | 1.5 |
| 12 | Copper | 3,849 | 1.4 |
| 13 | Meat (excl beef) | 3,733 | 1.4 |
| 14 | Refined petroleum | 2,807 | 1.1 |
| 15 | Wool & other animal hair (incl tops) | 2,417 | 0.9 |
| 16 | Medicaments (incl veterinary) | 2,415 | 0.9 |
| 17 | Alcoholic beverages (mainly wine) | 2,034 | 0.8 |
| 18 | Cotton | 2,008 | 0.8 |
| 19 | Passenger motor vehicles | 1,779 | 0.7 |
| 20 | Barley | 1,760 | 0.7 |
| Total goods exports (d) | 266,799 | 100 |
(a) Recorded trade basis.
(b) Excludes confidential items of trade.
(c) Mainly includes Zinc ores & concentrates, Manganese ores & concentrates and Lead ores & concentrates.
(d) Total goods exports on a balance of payments basis.
Based on ABS trade data on DFAT STARS database and ABS catalogue 5302.0.
Australia's major goods imports 2014 (a) (b)
| Rank | Commodity | $ million | % share |
|---|---|---|---|
| 1 | Crude petroleum | 20,050 | 7.5 |
| 2 | Refined petroleum | 18,579 | 7.0 |
| 3 | Passenger motor vehicles | 17,566 | 6.6 |
| 4 | Telecom equipment & parts | 9,845 | 3.7 |
| 5 | Medicaments (incl veterinary) | 7,497 | 2.8 |
| 6 | Computers | 7,316 | 2.7 |
| 7 | Goods vehicles | 6,008 | 2.3 |
| 8 | Heating & cooling equipment & parts | 4,210 | 1.6 |
| 9 | Gold | 4,005 | 1.5 |
| 10 | Pumps (excl liquid pumps) & parts | 3,870 | 1.5 |
| 11 | Furniture, mattresses & cushions | 3,624 | 1.4 |
| 12 | Measuring & analysing instruments | 3,208 | 1.2 |
| 13 | Electrical machinery & parts | 2,959 | 1.1 |
| 14 | Prams, toys, games & sporting goods | 2,844 | 1.1 |
| 15 | Vehicle parts & accessories | 2,740 | 1.0 |
| 16 | Plastic articles | 2,721 | 1.0 |
| 17 | Household-type equipment | 2,669 | 1.0 |
| 18 | Mechanical handling equip & parts | 2,642 | 1.0 |
| 19 | Civil engineering equipment & parts | 2,605 | 1.0 |
| 20 | Rubber tyres, treads & tubes | 2,525 | 0.9 |
| Total goods imports (d) | 266,451 | 100 |
(a) Recorded trade basis.
(b) Excludes confidential items of trade.
(c) Please note - imports of aircraft were made confidential by the ABS from Sept 2008 onwards. Imports of aircraft would rank in Australia's top 20 imports. DFAT estimates that aircraft imports were valued at around $3.8 billion in 2014.
(d) Total goods imports on a balance of payments basis.
Based on ABS trade data on DFAT STARS database and ABS catalogue 5368.0.
Australia's services exports 2014 (a)
| Services | $ million | % share |
|---|---|---|
| Manufacturing services on physical inputs owned by others | 18 | 0.0 |
| Maintenance & repair | 59 | 0.1 |
| Transport | 6,599 | 11 |
| Passenger (b) | 2,410 | 4.0 |
| Freight | 281 | 0.5 |
| Other | 2,543 | 4.0 |
| Postal & courier services | 1,365 | 2.3 |
| Travel | 35,427 | 59.0 |
| Business | 4,203 | 7.0 |
| Personal | 31,224 | 52.0 |
| Education-related | 17,037 | 28.0 |
| Other personal (c) | 14,187 | 23.6 |
| Other | 17,960 | 29.9 |
| Construction | 181 | 0.3 |
| Insurance & pension | 539 | 0.9 |
| Financial | 3,183 | 5.3 |
| Intellectual property charges | 975 | 1.6 |
| Telecommunications, computer & information | 2,166 | 3.6 |
| Other business services | 8,962 | 14.9 |
| Personal, cultural and recreational | 980 | 1.6 |
| Government services | 974 | 1.6 |
| Total services exports | 60,063 | 100 |
(a) Balance of payments basis.
(b) Passenger services include air transport-related agency fees & commissions.
(c) Inbound tourism for mainly recreational purposes.
Based on ABS catalogue 5302.0.
Australia's services imports 2013 (a)
| Services | $ million | % share |
|---|---|---|
| Manufacturing services on physical inputs owned by others | 0 | 0.0 |
| Maintenance & repair | 542 | 0.8 |
| Transport | 16,755 | 23.8 |
| Passenger (b) | 6,141 | 8.7 |
| Freight | 9,684 | 13.7 |
| Other | 814 | 1.2 |
| Postal & courier services | 116 | 0.2 |
| Travel | 29,146 | 41.3 |
| Business | 3,378 | 4.8 |
| Personal | 25,768 | 36.6 |
| Education-related | 1,171 | 1.7 |
| Other personal (c) | 24,597 | 34.9 |
| Other | 24,049 | 34.1 |
| Construction | 0 | 0.0 |
| Insurance & pension | 854 | 1.2 |
| Financial | 2,117 | 3.0 |
| Intellectual property charges | 4,479 | 6.4 |
| Telecommunications, computer & information | 2,955 | 4.2 |
| Other business services | 10,709 | 15.2 |
| Personal, cultural and recreational | 1,734 | 2.5 |
| Government services | 1,201 | 1.7 |
| Total services exports | 70,492 | 100.0 |
(a) Balance of payments basis.
(b) Passenger services include air transport-related agency fees & commissions.
(c) Outbound tourism for mainly recreational purposes.
Based on ABS catalogue 5302.0.
Australia's global export position
How we compare to the rest of the world 2014 (US$ billion)
| Rank | Country | Goods (a) | Services (b) | Total exports | % share |
|---|---|---|---|---|---|
| 1 | China | 2,342 | 234 | 2,576 | 10.7 |
| 2 | United States | 1,621 | 709 | 2,330 | 9.7 |
| 3 | Germany | 1,508 | 271 | 1,779 | 7.4 |
| 4 | Netherlands | 672 | 189 | 861 | 3.6 |
| 5 | France | 583 | 268 | 851 | 3.5 |
| 6 | United Kingdom | 506 | 342 | 847 | 3.5 |
| 7 | Japan | 684 | 163 | 846 | 3.5 |
| 8 | Republic of Korea | 573 | 107 | 680 | 2.8 |
| 9 | Italy | 529 | 117 | 646 | 2.7 |
| 10 | Hong Kong (c) | 524 | 106 | 630 | 2.6 |
| 11 | Belgium | 471 | 124 | 595 | 2.5 |
| 12 | Russian Federation | 498 | 66 | 564 | 2.3 |
| 13 | Canada | 475 | 86 | 561 | 2.3 |
| 14 | Singapore | 410 | 140 | 550 | 2.3 |
| 15 | India | 322 | 156 | 478 | 2.0 |
| 16 | Spain | 325 | 134 | 459 | 1.9 |
| 17 | Switzerland | 311 | 115 | 426 | 1.8 |
| 18 | Mexico | 398 | 21 | 419 | 1.7 |
| 19 | United Arab Emirates | 360 | 21 | 381 | 1.6 |
| 20 | Taiwan | 314 | 57 | 371 | 1.5 |
| 21 | Saudi Arabia | 354 | 12 | 366 | 1.5 |
| 22 | Australia | 241 | 54 | 295 | 1.2 |
| 23 | Thailand | 228 | 55 | 283 | 1.2 |
| 24 | Malaysia | 234 | 39 | 274 | 1.1 |
| 25 | Brazil | 225 | 40 | 265 | 1.1 |
| 26 | Poland | 217 | 48 | 265 | 1.1 |
| 27 | Ireland | 118 | 134 | 251 | 1.0 |
| 28 | Austria | 178 | 67 | 245 | 1.0 |
| 29 | Sweden | 164 | 77 | 241 | 1.0 |
| 30 | Turkey | 158 | 51 | 208 | 0.9 |
| Total exports | 19,002 | 5,017 | 24,019 | 100.0 |
(a) Goods on recorded trade basis.
(b) Services on balance of payments basis.
(c) Special Administrative Region of China.
Source: WTO online database.
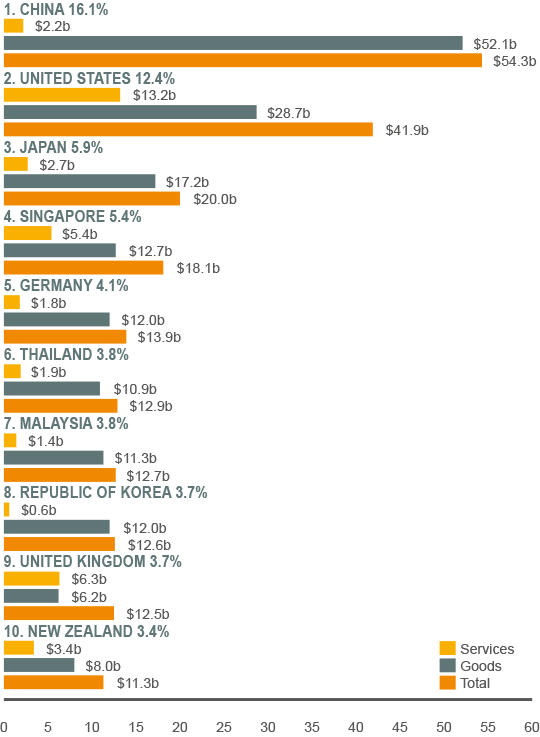
Australia's top 10 export Markets 2014 (a)
($ billion)

Total exports
($ billion)
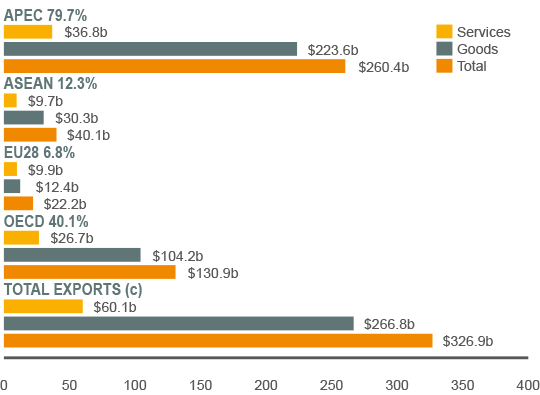
(a) All data is on a balance of payments basis, except for goods by country which are on a recorded trade basis.
(b) May exclude selected confidential export commodities. Refer to the DFAT website (/about-us/publications/trade-investment/Pages/dfat-adjustments-to-abs-official-trade-data.aspx) for more information and a list of the commodities excluded.
(c) Totals may not add due to rounding.
Actual goods export total based on unpublished ABS data, except for Singapore.
Based on ABS trade data on DFAT STARS database, ABS catalogue 5368.0.55.004 and unpublished ABS data.
Australia's global import position
How we compare to the rest of the world 2014 (US$ billion)
| Rank | Country | Goods (a) | Services (b) | Total imports | % share |
|---|---|---|---|---|---|
| 1 | United States | 2,413 | 476 | 2,888 | 12.0 |
| 2 | China | 1,959 | 384 | 2,343 | 9.8 |
| 3 | Germany | 1,216 | 328 | 1,543 | 6.4 |
| 4 | Japan | 822 | 192 | 1,014 | 4.2 |
| 5 | France | 678 | 248 | 926 | 3.9 |
| 6 | United Kingdom | 684 | 204 | 888 | 3.7 |
| 7 | Netherlands | 588 | 157 | 744 | 3.1 |
| 8 | Hong Kong (c) | 601 | 76 | 676 | 2.8 |
| 9 | Republic of Korea | 526 | 115 | 641 | 2.7 |
| 10 | India | 463 | 148 | 611 | 2.5 |
| 11 | Italy | 472 | 115 | 587 | 2.4 |
| 12 | Canada | 475 | 107 | 582 | 2.4 |
| 13 | Belgium | 452 | 115 | 568 | 2.4 |
| 14 | Singapore | 366 | 142 | 508 | 2.1 |
| 15 | Mexico | 412 | 35 | 446 | 1.9 |
| 16 | Russian Federation | 308 | 121 | 429 | 1.8 |
| 17 | Spain | 358 | 70 | 428 | 1.8 |
| 18 | Switzerland | 276 | 93 | 369 | 1.5 |
| 19 | United Arab Emirates | 262 | 71 | 333 | 1.4 |
| 20 | Brazil | 239 | 88 | 328 | 1.4 |
| 21 | Taiwan | 274 | 46 | 320 | 1.3 |
| 22 | Australia | 241 | 64 | 304 | 1.3 |
| 23 | Thailand | 228 | 53 | 281 | 1.2 |
| 24 | Turkey | 242 | 25 | 268 | 1.1 |
| 25 | Saudi Arabia | 163 | 97 | 260 | 1.1 |
| 26 | Poland | 220 | 36 | 256 | 1.1 |
| 27 | Malaysia | 209 | 45 | 254 | 1.1 |
| 28 | Austria | 182 | 53 | 235 | 1.0 |
| 29 | Sweden | 163 | 67 | 229 | 1.0 |
| 30 | Ireland | 71 | 142 | 213 | 0.9 |
| Total imports | 19,091 | 4,904 | 23,995 | 100.0 |
(a) Goods on recorded trade basis.
(b) Services on balance of payments basis.
(c) Special Administrative Region of China.
Source: WTO online database.
Australia's top 10 import sources 2014 (a) (b)
($ billion)
Total imports
($ billion)
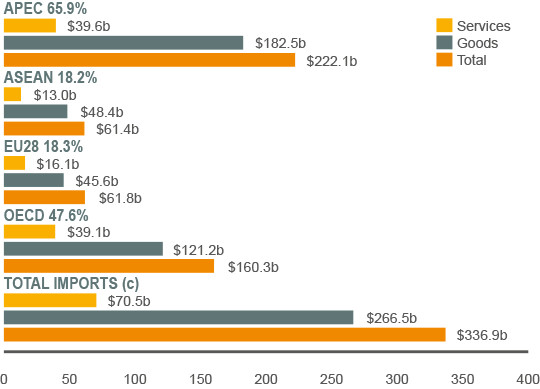
(a) All data is on a balance of payments basis, except for goods by country which are on a recorded trade basis.
(b) May exclude selected confidential import commodities. Refer to the DFAT website (/about-us/publications/trade-investment/Pages/dfat-adjustments-to-abs-official-trade-data.aspx) for more information and a list of the commodities excluded.
(c) Totals may not add due to rounding.
Actual goods import total based on unpublished ABS data, except for Singapore.
Based on ABS trade data on DFAT STARS database, ABS catalogue 5368.0.05.004 and unpublished ABS data.
Top 10 two-way trading partners 2014 (a) (b)
($ billion)
| Rank | Country | Goods | Services | Total | % share | |
|---|---|---|---|---|---|---|
| 1 | China | 142.1 | 10.4 | 152.5 | 23.0 | |
| 2 | Japan | 65.4 | 4.8 | 70.2 | 10.6 | |
| 3 | United States | 40.6 | 19.8 | 60.4 | 9.1 | |
| 4 | Republic of Korea | 32.4 | 2.2 | 34.6 | 5.2 | |
| 5 | Singapore | 21.1 | 9.1 | 30.2 | 4.5 | |
| 6 | New Zealand | 16.1 | 7.4 | 23.5 | 3.5 | |
| 7 | United Kingdom | 9.9 | 10.9 | 20.8 | 3.1 | |
| 8 | Malaysia | 17.4 | 3.2 | 20.6 | 3.1 | |
| 9 | Thailand | 16.1 | 2.9 | 19.0 | 2.9 | |
| 10 | Germany | 13.7 | 3.0 | 16.7 | 2.5 | |
| Total top 10 trading partners |
374.9 | 73.6 | 448.5 | 67.6 | ||
| Total two-way trade | 533.3 | 130.6 | 663.8 | 100.0 | ||
| of which: | APEC | 406.1 | 76.4 | 482.5 | 72.7 | |
| ASEAN | 78.7 | 22.8 | 101.5 | 15.3 | ||
| EU28 | 58.0 | 26.0 | 84.0 | 12.7 | ||
| OECD | 225.4 | 65.9 | 291.2 | 43.9 | ||
(a) All data is on a balance of payments basis, except for goods by country which are on a recorded trade basis.
(b) May exclude selected confidential export and import commodities. Refer to the DFAT website (/about-us/publications/trade-investment/Pages/dfat-adjustments-to-abs-official-trade-data.aspx) for more information and a list of the commodities excluded.
(c) Totals may not add due to rounding.
Based on ABS trade data on DFAT STARS database, ABS catalogue 5368.0.05.004 and unpublished ABS data.
Total two-way trade by region 2014
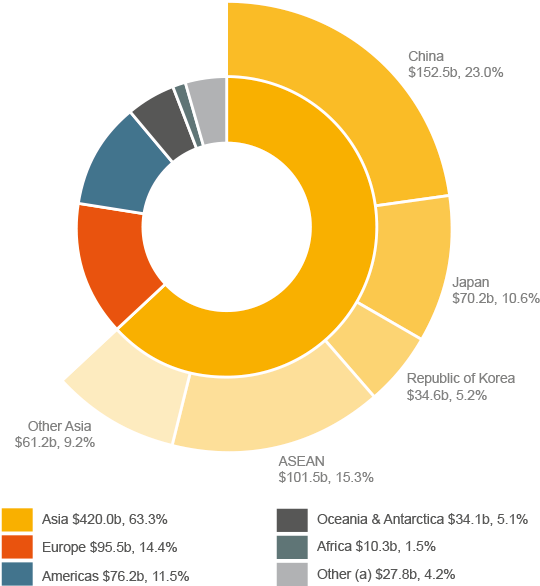
Regional breakdowns:
Asia includes Central Asia; Middle East; North Asia; South East Asia and Southern Asia.
Europe includes Eastern Europe; Northern Europe; South Eastern Europe; Southern Europe and Western Europe.
Americas includes North America; Caribbean; Central America and South America.
Oceania & Antarctica includes Antarctica; Pacific Islands and Other Oceania.
Africa includes Central & West Africa; North Africa and Southern & East Africa.
(a) Includes confidential items of trade.
Based on ABS trade data on DFAT STARS database, ABS catalogue 5368.0.55.004 and unpublished ABS data.