Australia's two-way trade in goods and services grew at a moderate pace
in 2015, despite global economic headwinds. Two-way trade recorded
a 0.9 per cent rise to $668.5 billion, up from $662.3 billion in 2014,
representing another record high for Australia. Though our top two-way
trading partners remained the same, their rank order changed for 2015.
In order, these partners were China, the United States, Japan, and the
Republic of Korea, followed by Singapore.
Australia's Top 5 Two-Way Trading Partners 2015
Australia's trade and investment performance has
contributed significantly to the country's remarkable record
of twenty-five years of uninterrupted economic growth and
will continue to do so. Today, trade in goods and services is
equivalent to more than 40 per cent of Australia's GDP and
one in five Australian jobs is trade-related.– Steven Ciobo, Minister for Trade, Tourism and Investment
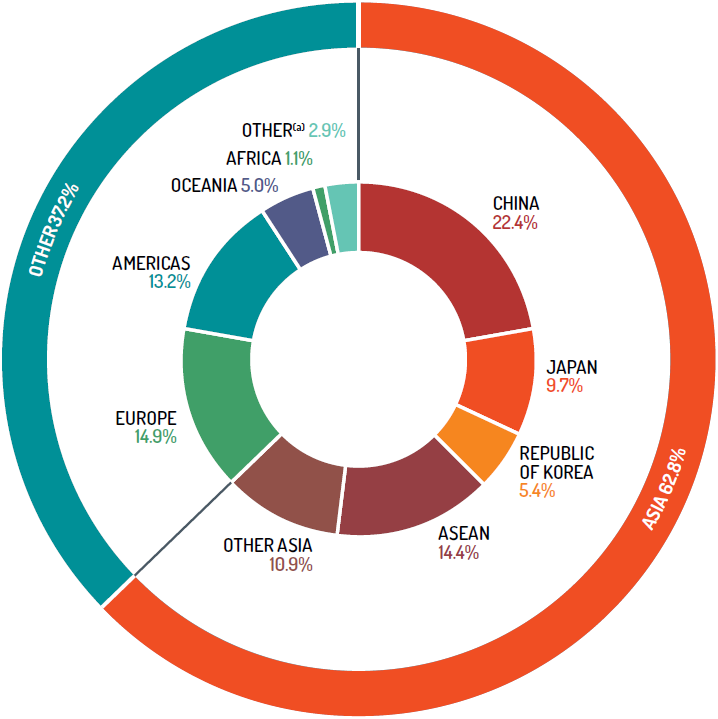
Australia's Two-Way Trade by Region 2015
Regional breakdowns:
Asia includes Central Asia; Middle East; North Asia; South East Asia and Southern Asia
ASEAN includes Brunei, Cambodia, Indonesia, Laos, Malaysia, Myanmar, Philippines, Singapore, Thailand and Vietnam.
Europe includes Eastern Europe; Northern Europe; South Eastern Europe, Southern Europe and Western Europe.
Americas includes North America; the Caribbean; Central America and South America.
Oceania includes Antarctica and Pacific Island countries and territories.
Africa includes Central and West Africa; North Africa and Southern and East Africa.
(a) Includes confidential items of trade.
Based on ABS catalogues 5368.0 and 5368.0.55.004 and unpublished ABS data.
Australia's Top 10 Two-Way Trading Partners(a)(b) 2015
|
(A$ billion)
|
|||||
|---|---|---|---|---|---|
| Rank | Country | Goods | Services | Total | % share |
| 1 | China | 137.5 | 12.3 | 149.8 | 22.4 |
| 2 | United States | 47.2 | 22.9 | 70.2 | 10.5 |
| 3 | Japan | 59.9 | 5.0 | 65.0 | 9.7 |
| 4 | Republic of Korea | 33.4 | 2.6 | 36.1 | 5.4 |
| 5 | Singapore | 16.2 | 9.4 | 25.7 | 3.8 |
| 6 | New Zealand | 16.1 | 7.9 | 24.0 | 3.6 |
| 7 | United Kingdom | 10.9 | 12.3 | 23.2 | 3.5 |
| 8 | Thailand | 17.9 | 2.9 | 20.8 | 3.1 |
| 9 | India | 15.2 | 4.7 | 19.8 | 3.0 |
| 10 | Malaysia | 16.0 | 3.2 | 19.2 | 2.9 |
| Total top 10 trading partners | 370.5 | 83.2 | 453.7 | 67.9 | |
| Total two-way trade(c) | 526.2 | 142.2 | 668.5 | ||
| of which: | APEC | 402.1 | 84.6 | 486.7 | 72.8 |
| ASEAN | 72.5 | 23.5 | 95.9 | 14.4 | |
| EU28 | 59.4 | 29.9 | 89.3 | 13.4 | |
| OECD | 230.5 | 73.6 | 304.0 | 45.5 | |
(a) All data is on a balance of payments basis, except for goods by country which are on a recorded trade basis.
(b) May exclude selected confidential export and import commodities. Refer to the DFAT website (/about-us/ publications/trade-investment/Pages/dfat-adjustments-to-abs-official-trade-data.aspx) for more information and a list of the commodities excluded.
(c) Totals may not add due to rounding.
Based on ABS trade data on DFAT STARS database, ABS catalogue 5368.0.05.004 and unpublished ABS data.


