Foreign investment has allowed Australia to enjoy higher rates of
economic growth, employment and living standards than could have
been achieved through domestic savings alone. Our economy was partly
built on successive waves of investment from Britain, followed by the
United States and Japan. China has become a major and growing source
of investment. The value of Australia's total two-way investment reached
$5.1 trillion, up 8.0 per cent from $4.7 trillion in 2014. The United States,
the United Kingdom, Japan, Belgium and Singapore were Australia's top
five two-way investment partners in 2015.
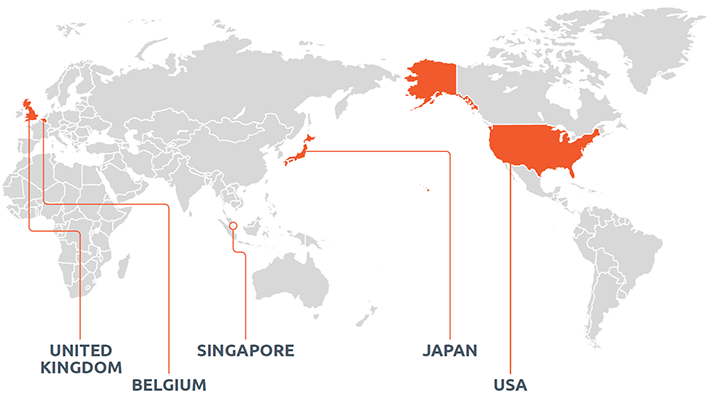
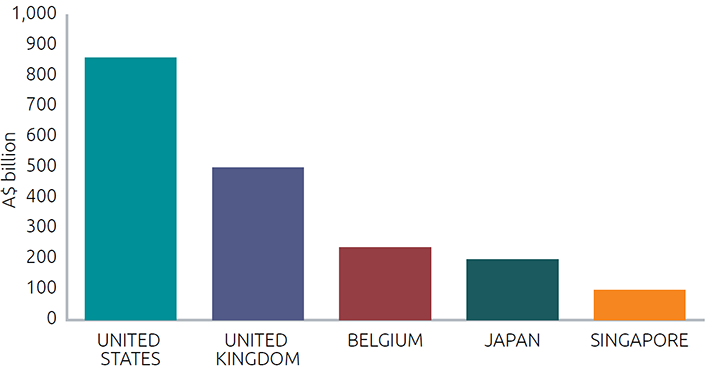
In 2015, the stock of total foreign investment into Australia reached
$3 trillion. Australia's major sources were the United States at
$860.3 billion, the United Kingdom at $499.9 billion, Belgium at
$238.5 billion, Japan at $199.6 billion and Singapore at $98.6 billion.
Chinese investment reached nearly $75 billion at the end of 2015, making
it our seventh largest investor.
Australia's Top 10 Foreign Investment Sources(a) 2015
| Rank(b) | Country | FDI | Total investment(c) |
|---|---|---|---|
| 1 | United States | 173,503 | 860,313 |
| 2 | United Kingdom | 76,042 | 499,930 |
| 3 | Belgium | 2,197 | 238,544 |
| 4 | Japan | 85,949 | 199,596 |
| 5 | Singapore | 28,800 | 98,579 |
| 6 | Hong Kong(d) | 11,918 | 85,359 |
| 7 | China | 35,171 | 74,862 |
| 8 | The Netherlands | 44,444 | 62,995 |
| 9 | Luxembourg | 2,449 | 58,322 |
| 10 | Switzerland | 7,939 | 50,198 |
| Total all countries | 735,494 | 3,024,361 | |
| of which: | APEC | 381,338 | 1,456,048 |
| ASEAN | 41,506 | 126,652 | |
| EU28 | 157,627 | 990,857 | |
| OECD | 459,211 | 2,199,761 |
(a) Foreign investment in Australia: level of investment (stocks) as at 31 December 2015, by selected country and country group.
(b) Ranked on level of total investment in Australia.
(c) Includes portfolio investment.
(d) Special Administrative Region of China.
Source: ABS catalogue 5352.0.
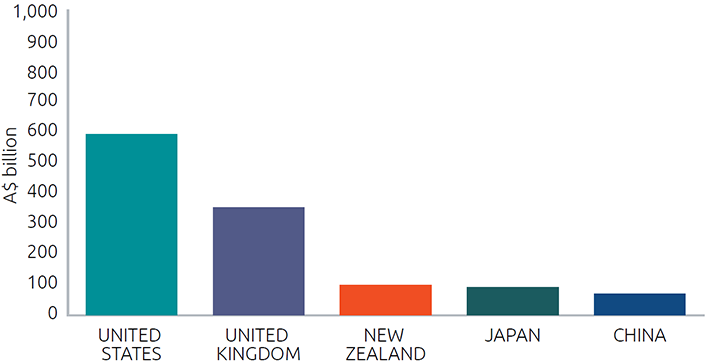
Australia's Top 10 Foreign Investment Destinations(a) 2015
| Rank(b) | Country | ADI | Total Investment(c) |
|---|---|---|---|
| 1 | United States | 105,247 | 594,425 |
| 2 | United Kingdom | 81,258 | 353,204 |
| 3 | New Zealand | 60,520 | 98,693 |
| 4 | Japan | np | 93,164 |
| 5 | China | 14,107 | 70,230 |
| 6 | Singapore | 21,209 | 67,056 |
| 7 | Germany | np | 66,914 |
| 8 | Hong Kong(d) | 4,618 | 50,696 |
| 9 | Cayman Islands | np | 49,516 |
| 10 | France | 2,193 | 45,616 |
| Total all countries | 542,611 | 2,080,714 | |
| of which: | APEC | 249,987 | 1,097,192 |
| ASEAN | 37,644 | 100,731 | |
| EU28 | 111,789 | 589,467 | |
| OECD | 290,406 | 1,443,883 |
(a) Australian investment abroad: level of investment (stocks) as at 31 December 2015, by selected country and country group.
(b) Ranked on total Australian investment abroad.
(c) Includes portfolio investment.
(d) Special Administrative Region of China.
Source: ABS catalogue 5352.0.
Australia's Top 5 Total Foreign Investment Sources 2015
Australia's Top 5 Total Investment Abroad Destinations 2015