Key points
- By 2040, Southeast Asia will be an economic powerhouse fuelled by favourable demographics, industrialisation, urbanisation and technological advances.
- Southeast Asia (as a bloc) is projected to become the world's fourth-largest economy by 2040, after the United States, China and India, with an expected compound annual growth rate of 4 per cent between 2022 and 2040.4
- A large and growing population will lead to greater spending on lifestyle, education and housing, while there will be increasing demand for health and aged care services.5
- By 2040, projections suggest that – based on the after-tax income of households – the potential consumer market in Southeast Asia will be 10 times larger than Australia's.6
- Australia's trade and investment growth with the region have not kept pace with Southeast Asia's economic growth over the past 20 years.
- Developments in key sectors provide opportunities to significantly increase Australia – Southeast Asia trade and investment.
Opportunity and necessity
Southeast Asia is at the centre of global growth. The region presents major economic opportunities for Australian business over coming decades.
Southeast Asia is a development and economic success story. In 2022, Southeast Asia's combined nominal gross domestic product (GDP) of around US$3.6 trillion was larger than the economies of the United Kingdom, France or Canada, and around twice the size of the Australian economy.7
This remarkable development is set to continue, with compound annual GDP growth projected at around 4 per cent until 2040, while developed economies are likely to average GDP growth of 1 to 2 per cent.8 By 2040, Southeast Asia as a bloc is likely to be the fourth-largest economy in the world.9 Fifty-five per cent of the region's 687 million population is under the age of 35, and this youthful demographic forms a base for a large, productive working-age population to 2040 and beyond.10
Southeast Asia's middle class, already numbering at least 190 million people, will continue to expand.11 This cohort will seek higher-value products and services, including in healthcare, education, financial technology, and premium food and beverages.
Australia's post–World War II prosperity has been a consequence of successive waves of industrialisation and urbanisation in Japan, the Republic of Korea, Taiwan, China and India. Australia has also benefited from, and contributed to, Southeast Asia's growth and stability, boosting national income and creating jobs.
Looking ahead, Australia has the capabilities to help the region meet its goods, services, skills and capital needs. Australia will also benefit from further Southeast Asian investment and exports.
Southeast Asia's continued economic success is critical for Australia's prosperity and security. The region is facing growing geostrategic competition. Supply chain diversification is in the region's and Australia's mutual interests. Expanding economic linkages between Australia and Southeast Asia provides choices and creates shared wealth, contributing to a strategic equilibrium. This, along with upholding international rules and norms, will help underpin enduring peace and economic growth in the region.
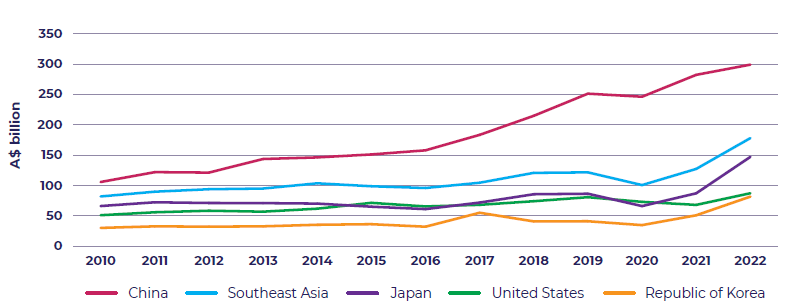
In pursuing opportunities, Australia and Southeast Asian nations have a solid foundation on which to build. Economic links and cooperation have existed between Australian First Nations peoples and regional communities for centuries. Most recently, two-way trade between Australia and Southeast Asia was worth around A$178 billion in 2022, larger than Australia's trade with the United States.12
Australia is part of a web of bilateral and regional free trade agreements with Southeast Asia, including the Agreement Establishing the ASEAN – Australia – New Zealand Free Trade Area (AANZFTA) and the Regional Comprehensive Economic Partnership Agreement (RCEP).
There is much more Australia and the region can, and should, be doing to boost their economic relationship. Australia's trade and investment with the region has not kept pace with the growth of Southeast Asian economies. As a near neighbour, and with significant economic complementarities, Australia should be a larger trade and investment partner of Southeast Asia.
Further diversification of trade partners and products is critical for Australia's long-term national economic resilience. Over-reliance on a few markets presents long-term structural risks for any economy and business, and the COVID-19 pandemic and geopolitical and geoeconomic headwinds of recent years have underlined the need for trade and investment diversification.
To realise the potential in the years to 2040, investment across business and government will be needed. For Australia, an active, whole-of-nation effort will be required to make the most of current and emerging opportunities. If Australia fails in this, it will not be possible to maintain the status quo as the Southeast Asian economies grow relative to the Australian economy, and other competitors intensify their trade promotion and investment activities.
It will be necessary to address various obstacles, including a lack of business awareness, barriers, and the opportunity costs of business with the region and Australia vis-à-vis other alternatives that have limited commercial ties to date. There is a role for governments – in Australia and in Southeast Asia – to do more to help address perceptions of risk, to remove barriers, and create more-enabling business environments.
That is why this strategy is important. It outlines the actions that need to be taken to translate Southeast Asia's economic potential into greater opportunities for Australian businesses and investors, in partnership with the region's businesses and communities. These actions will be integral to increasing Australia's and Southeast Asia's economic growth and resilience and to advance our shared interests in a secure and prosperous region.
The existing trade relationship
In 2022, Australia's two-way trade in goods and services with Southeast Asian countries was second only to Australia's trade with China (Figure 1.1).13
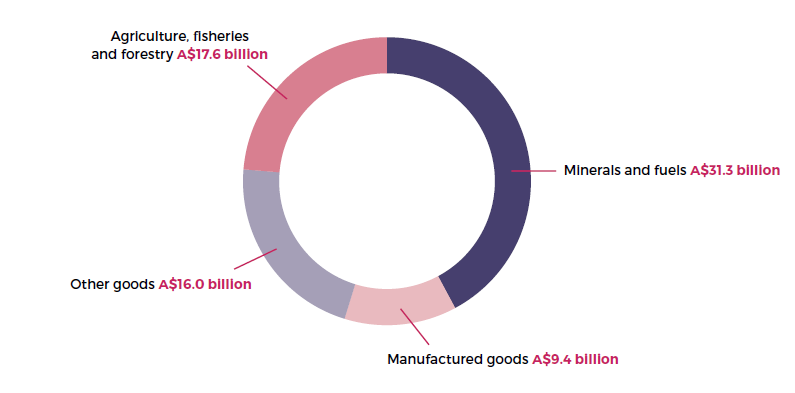
Our biggest export sector to the region is minerals and fuels (Figure 1.2).14
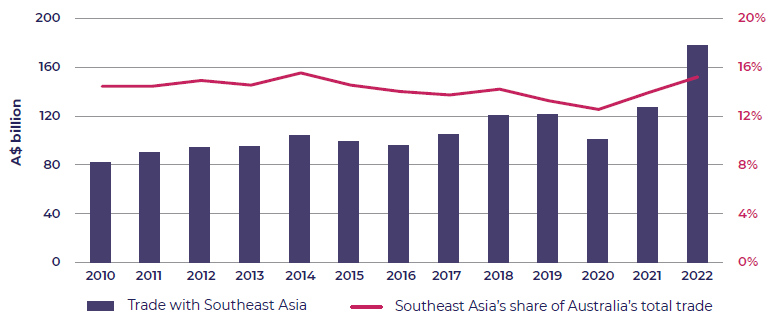
While the nominal value of Australia's two-way goods and services trade with Southeast Asia has grown steadily, its share of Australia's overall trade has not changed in over 15 years (Figure 1.3).
In nominal terms, total Australian trade grew by an average of 5.5 per cent between 2001 and 2021; however, during this period the average economic growth rate in the region was 8.5 per cent.15
Australia is a relatively small external trading partner for Southeast Asia. Australia ranked as ASEAN's eighth-largest two-way goods trading partner in 2022, representing just 3.4 per cent of the bloc's goods trade.16 Australia's proportion of total Southeast Asian trade has remained relatively constant over the past 20 years.17
Growth in Australia's trade has been uneven across categories, with goods trade growing by an average of 7.7 per cent over the past two decades, while average growth in services trade has lagged at 4.7 per cent.18
Australia's export trade is concentrated narrowly, with a relatively small number of exporters dominating trade in key regional markets. Approximately 250 exporters drive over 90 per cent of Australian merchandise exports to Southeast Asia.19 And of Australia's top 500 exporters, fewer than 40 per cent have any meaningful exports to Southeast Asia.20
While Australia's trade performance with the region has been consistent, it has not kept pace with Southeast Asia's GDP growth and is not sufficiently diversified to maximise benefit from the emerging opportunities.
Figure 1.1 Total two-way goods and services trade with Southeast Asia relative to other major trading partners, 2010–2022
Source: DFAT, Direction of Goods and Services Trade, July 2023.
Figure 1.2 Composition of Australian goods exports to Southeast Asia, by sector, 2022
Note: Excludes crude petroleum due to confidentiality in Australian export statistics.
Source: DFAT, Standard International Trade Classification pivot table, May 2023.
Figure 1.3 Australia's total goods and services trade with Southeast Asia, 2010–2022
Source: DFAT, Standard International Trade Classification pivot table, May 2023.
Australian investment in Southeast Asia
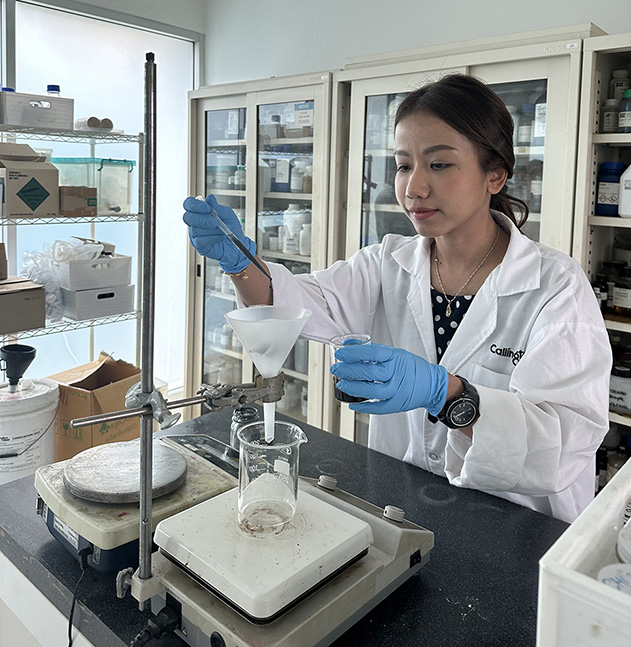
A number of Australian companies have invested directly in the region, including Orica and ANZ (in Indonesia and the Philippines), ResMed, Lendlease and QBE (in Singapore), Cochlear and Arnott's (in Malaysia), Telstra, Toll Group and GHD (in the Philippines) and Callington (in Thailand – see case study).
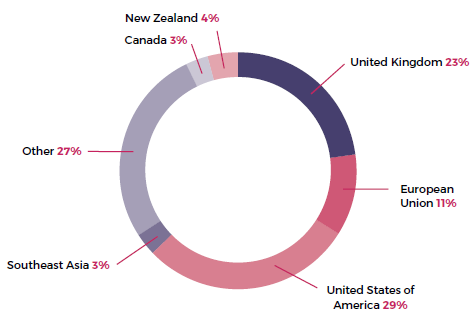
Presently, Australian investment in the region is underweight. Australian foreign investment stocks in Southeast Asian countries were worth A$123.1 billion in 2022, representing 3.4 per cent of Australia's total investment stocks abroad (A$3.7 trillion).21
Investment was concentrated in Singapore (A$76.2 billion) and Timor-Leste (A$16.7 billion, nearly all of which is in a single investment in Santos's Bayu-Undan gas facility).22 Only 0.8 per cent (or A$40.4 billion) of Australia's total investment stock abroad went to the remaining nine ASEAN countries.23 While some of the investment going through Singapore ends up in other Southeast Asian countries, such as Indonesia, these figures were significantly less than Australian investment in some traditional partners' economies (Figure 1.4).
Figure 1.4 Share of Australia's outward foreign investment stocks, by destination, 2022
Note: Percentage of total outward foreign investment.
Source: DFAT analysis of ABS, International Investment Position, Australia: Supplementary Statistics, 2022, May 2023.
Case study: Callington's trusted partnerships key to its investment in Thailand
Callington Group is an Australian, family-owned specialty industrial chemicals manufacturer whose products and services are used in more than 60 countries worldwide.
Callington manufactures in 10 countries, including Thailand, and has research and development centres and laboratories in Bangkok, Sydney, Paris and Chennai. The longest-running and largest operations are based in Thailand, where the company has supplied the Thai market since 1971.
Callington Thailand Managing Director, Geoff Everett, said, 'Thailand has been key to the company's success because of its connections to major regional markets, infrastructure project opportunities, and almost tariff-free trade between Australia and ASEAN.'
Foreign companies previously had challenges of dealing with multiple government agencies when trying to invest in Thailand. However, the establishment of the Thailand Board of Investment in 1997 by the Government of Thailand has helped to streamline the overall investment process through its 'one-stop shop' approach.
'The Board of Investment has made it much easier to invest in Thailand, whether it's tax and other incentives, support navigating rules and regulations under various ministries, or facilitating business connections,' said Mr Everett.
For Australian businesses interested in investing in Thailand, Callington recommended Austrade, the Australian Embassy in Bangkok, and the Australian-Thai Chamber of Commerce (AustCham Thailand) for local insights and advice. Austrade helped Callington establish connections with other businesses and government authorities, and provided assistance in working with regulatory agencies in Thailand.
Mr Everett said Callington's trusted partnerships in Southeast Asia are a critical factor in the company's expansion strategy.
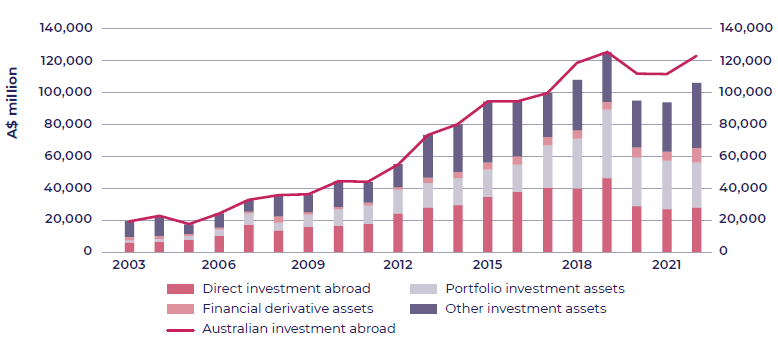
Figure 1.5 Australian investment in Southeast Asia, by type of investment stocks, 2003–2022
Note: Data for Timor-Leste is only available at the 'Australian investment abroad' level in 2018, 2020, 2021 and 2022, and is therefore not reflected in the subcategories of investment for these years.
Source: DFAT analysis of ABS, International Investment Position, Australia: Supplementary Statistics, 2022, May 2023.
There was an upward trajectory from 2003 to 2019 in Australian outward investment into Southeast Asia across all investment types. However, there was a significant drop in foreign direct investment (FDI) stocks (that is, a net outflow) from 2019 to 2021 (Figure 1.5). This reflects a series of Australian divestments across the mining, banking and aviation services sectors that took place during this time.
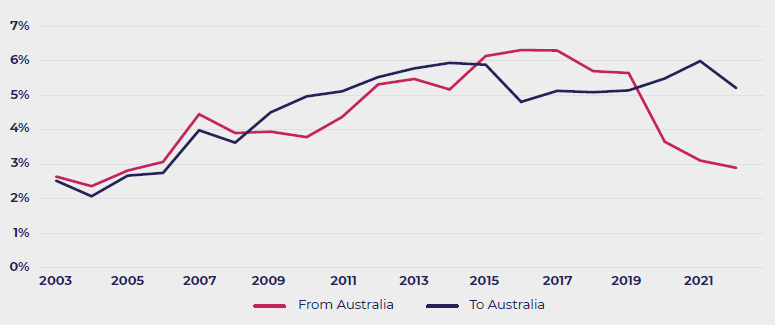
As a result, Figure 1.6 shows that ASEAN's share of FDI stocks from Australia fell from 6.3 per cent in 2017 to 2.9 per cent in 2022.
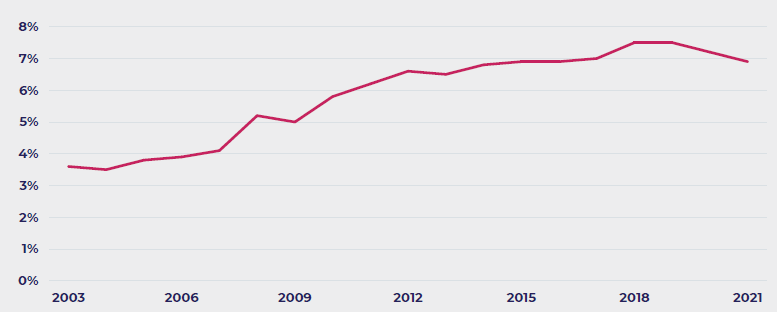
In comparison, Southeast Asia's share of global FDI has increased over the past two decades – up from 3.6 per cent in 2003 to 6.9 per cent in 2021 (figure 1.7).24 The region has been a major recipient of global FDI into developing economies in the past decade (second after China in 2020–21).25
Australian investment has not kept pace with the growth of investment into the region. Between 2000 and 2021, Southeast Asia's global inflows of direct investment increased an average 13 per cent a year (stocks). Australia's direct investment to Southeast Asia increased an average 8 per cent a year (stocks) during this period but fell as a share of Australia's total investment abroad from 2017 onwards (Figure 1.6).26
Figure 1.6 ASEAN's share of FDI stock with Australia, 2003–2021
Note: Percentage of total foreign direct investment stock with Australia.
Source: DFAT analysis of ABS, International Investment Position, Australia: Supplementary Statistics, 2022, May 2023.
Figure 1.7 Southeast Asia's share of global inward FDI stocks, 2003–2021
Note: Percentage of total global inward foreign direct investment stocks.
Source: DFAT analysis of United Nations Conference on Trade and Development, 'Foreign direct investment: Inward and outward flows and stock, annual', [Beyond 20/20 WDS dataset, n.d., accessed 2 June 2023.
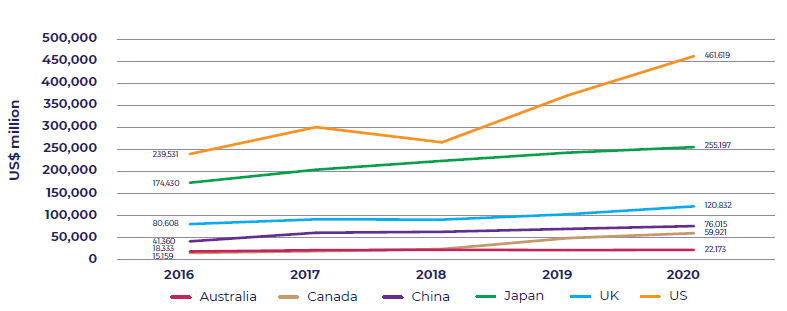
Figure 1.8 Stocks of FDI into selected ASEAN countries at year-end, by source country, 2016–2020
Note: Selected countries are Cambodia, Indonesia, Malaysia, Singapore and Thailand, based on data availability.
Source: DFAT analysis of ASEAN Secretariat, 'Stocks of foreign direct investment (FDI) at year-end, by source country (in million US$)', ASEAN Stats Data Portal, n.d., accessed 1 June 2023.
Box 1.1 Canada's investment in Southeast Asia
As Figure 1.8 shows, Canada's FDI in Southeast Asia has expanded quickly in recent years. Beyond simply growth in stock levels, Canadian investments, particularly from their pension funds, have also broadened across many sectors, including oil and gas, mining, high tech, telecommunications, agrifood, financial services, aviation, and consumer goods.27
From consultations undertaken as a part of developing this strategy, it is clear that Canadian institutional investors are a few years ahead of some counterparts in developing trusted relationships for investment, including having spent more time on the ground understanding markets, taking minority stakes in businesses, joining boards, and building experience in the region.
Australia's investment to ASEAN is significantly less than Australia's foreign investment with New Zealand.28 The scale of, and growth in, FDI stock in Southeast Asia from a range of other partners has far outstripped Australia's FDI stock in the region from 2010 to 2021.29 Chinese investment stocks in Southeast Asia almost doubled between 2016 and 2020 and Canadian stocks grew almost fourfold (Figure 1.8 and Box 1.1).30
The current level of Australian investment reflects a range of challenges. Some Australian investors continue to view the region's risk–return trade-off as unattractive. But those who have successfully invested in the region have adopted a long-term orientation, recruited the right local talent, and partnered to understand the local market and its risks. This, in turn, has opened up further opportunities for them.
For Australian institutional investors, transactions in emerging markets in Southeast Asia – particularly FDI – are generally deemed as higher-risk alternatives, which can affect asset allocation. Box 1.2 provides further detail on opportunities and challenges for this group of investors.
To attract more investment, Southeast Asian authorities will need to continue to invest in a robust public sector to ensure best practice governance. Strong regulatory frameworks (for example, competition, financial reporting and intellectual property protection) will foster a dynamic and well-functioning business sector.
Box 1.2 Australian institutional investors and Southeast Asia
The growing pool of investable projects in Southeast Asia provides significant opportunities to deepen Australian investment in the region in the decades to come.
Historically, opportunities for foreign direct investment in the region have not always been a good fit for Australia's institutional investors. Australian investors undertake significant due diligence, which requires detailed information to understand governance and financing structures, to be confident transactions adhere to investment mandates and, in the case of superannuation funds, their fiduciary duties. These due-diligence requirements likely explain the lower commercial presence in Southeast Asia due to significant transaction cost considerations.
Creating the right enabling environment for investment would likely improve investment outcomes for Australian institutional investors. This requires ongoing advocacy for continued structural reform to harmonise regulations and improve institutional cooperation. For example, following consultations raising concerns over the impact of the 'Your Future, Your Super' performance test benchmarks on funds' asset allocation strategies, the Australian Government announced in June 2023 that the introduction of an emerging markets index would help ensure that funds are not unintentionally discouraged from investing in certain assets.
Increasing familiarity between Australian investment professionals and Southeast Asian counterparts – to deepen understanding of where needs align and do not – will also assist. This could be achieved through sharing market insights and information, including on time horizons for investment decisions by Australian funds, and through business missions.
The Australian Government should continue to encourage superannuation funds to examine opportunities in the region, including building on the visit organised to Indonesia and Singapore in August 2022.
Southeast Asian investment in Australia
Key Southeast Asian investors in Australia include ACEN in green energy (see case study in Chapter 5); RATCH in renewable energy; Pontiac Land Group in real estate development; Gamuda in major infrastructure projects (see case study in Chapter 6); Hoa Phat in beef cattle and iron ore; and Bukalapak in e-commerce (see case study in chapter 10).
Australia has been gaining status as a favoured investment destination for Southeast Asian countries. Stocks of ASEAN's FDI into Australia in 2022 were A$58.3 billion,31 compared with stocks of Australian outward FDI into ASEAN of A$28.3 billion.32 Total stocks of ASEAN's FDI into Australia increased an average 11.5 per cent a year (A$50.9 billion overall) between 2003 and 2022.33 In 2022, Singapore – as the region's financial hub – was the largest source of investment among ASEAN countries and is Australia's fifth-largest investor. The value of Singapore's investment stocks (including direct, portfolio and other investment) in Australia has grown at a rate of 11.4 per cent a year over the past five years.34 Singapore's investment includes Singaporean Government entities and multinationals based there.
Given Australia's sound economic fundamentals and transparent and trustworthy legal and governance systems, it will likely remain an attractive investment destination for the region. Companies looking to expand abroad into Australia wish to broaden their asset base and bring advanced technology and know-how back into their domestic operations. As Australia and Southeast Asian countries seek to meet their net zero targets out to 2040 and beyond, the region's investors will increasingly be entering new industries in Australia, including renewable energy and clean energy supply chains.
Outlook to 2040
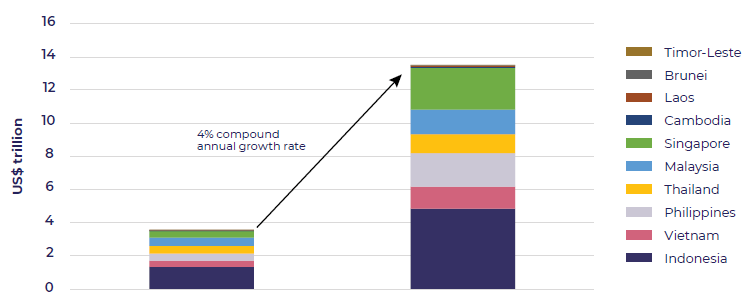
Southeast Asia is expected to continue to grow strongly over the next two decades. As a regional bloc, by 2040, Southeast Asia is projected to become the world's fourth-largest economy, after the United States, China and India. As Figure 1.9 highlights, analysis by the Economist Intelligence Unit estimates that, in 2022, total nominal GDP for Southeast Asia was worth US$3.60 trillion and by 2040, total nominal GDP will grow by nearly 383 per cent to US$13.86 trillion, with Indonesia alone projected to have a nominal GDP worth US$4.85 trillion.35
Indonesia's economy is projected to become the world's fifth-largest by 2040, while Thailand and Vietnam are expected to be the next largest economies in the region.36 , Indonesia, the Philippines and Vietnam are forecast to have compound annual GDP growth rates of around 5 per cent between 2022 and 2040.37 Singapore is expected to maintain its high-income status, while emerging economies like the Cambodia are predicted to experience rapid economic growth.38
Driving this growth, Nomura predicts an acceleration of FDI and portfolio investment flows into Southeast Asia (and India) – the 'new high-flying geese' of Asian development – from North Asia prompted by supply chain diversification, infrastructure development, and cashed-up savings funds seeking to spread risk. These countries are increasingly seen by Japanese companies as preferred destinations for business expansion.39
There will be challenges along the way in realising these projections, including how economies deal with issues such as persistent inflation, and concerns over serviceability of debt and access to credit. Trends in 'friendshoring', or investment directed along geopolitical lines, pose additional risks to growth for emerging economies in Asia. This trend is only clearly emerging in 2023, but should it gain momentum, is likely to amplify economic downturns.
It will be critical to continue reducing barriers to trade and investment and pursuing integration. If this occurs, the long-term trajectory points to a region that will continue to be one of the main sources of global growth.
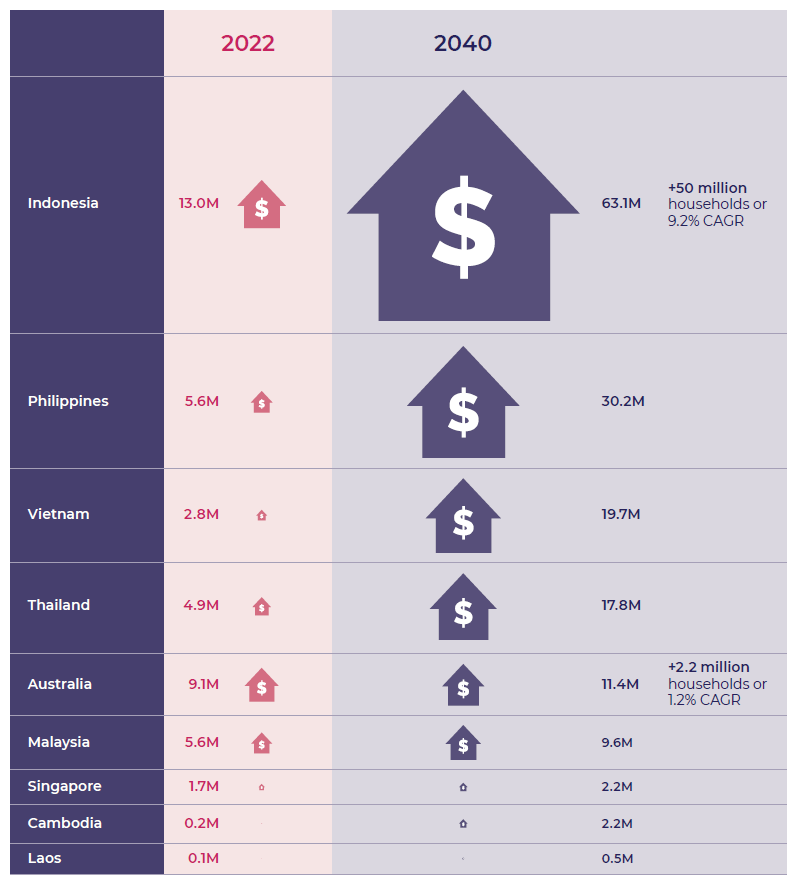
In key trends, much of Southeast Asia's economic growth will come from its expanding middle class and the related increase in consumer demand. Figure 1.10 highlights this growth, based on projected after-tax income of households, showing a potential consumer market in Southeast Asia that will be over 10 times larger than Australia's.40
Most Southeast Asian countries have a relatively young population, with the current median age at 29.6 years (2023).41 The United Nations forecasts that by 2040, Southeast Asia's population will reach 785.8 million, up from an estimated 633.6 million in 2021, with a working-age population (people aged 15 to 64) of around 562 million.42 The latter is a significant increase from the estimated 464 million in 2021.43 This 'demographic dividend' will lead to greater spending on lifestyle, education, travel and housing over coming decades.
Figure 1.9 Nominal GDP of Southeast Asian economies, 2022 (estimate) and 2040 (forecast)
Source: Economist Intelligence Unit (2023) data commissioned by DFAT for the strategy.
Figure 1.10 Number of Southeast Asian and Australian households with disposable income of more than US$15,000 per annum (constant), 2022 and 2040 (forecast)
CAGR = compound annual growth rate
Notes: Excludes Brunei and Timor-Leste. Constant dollars measure changes in real purchasing power over time as they account for inflation.
Source: Austrade Economics analysis of Euromonitor, Economies and Consumers data, 2022.
Notwithstanding its generally young population, the number of people aged over 60 in the region is expected to reach 127 million people in 2035, and by 2040, retirees will account for one in five people.44 This will increase demand for health and aged care services. Australia can help meet the needs of Southeast Asians, but this will require facilitating more trade in medical technology, supporting increased standards of care and investment in health infrastructure, and harmonising standards and regulation.
For all countries, empowering women and girls to participate in business, ensuring equality of salaries, addressing the unequal distribution of unpaid care and domestic work, and improving social infrastructure will unlock economic dividends. Women's formal workforce participation varies widely across the region, from 69.9 per cent in Cambodia to 27.9 per cent in Timor-Leste.45 Further, across Southeast Asia, women's formal workforce participation has decreased over the past 10 years, declining in all countries in the region except Indonesia.46 In 2022, Australia's women's workforce participation rate was 62.1 per cent and the gender pay gap persisted at 22.8 per cent.47
The other major population trend is urbanisation. According to the United Nations Economic and Social Commission for Asia and the Pacific, the proportion of people living in cities will increase from 51 to 61 per cent between 2022 and 2040.48 Within that statistic, the most significant shift from rural to urban areas will occur in Cambodia, the Philippines, Laos, Timor-Leste and Vietnam.
Rising populations and urbanisation will influence demand for infrastructure and energy. According to the Asian Development Bank, Southeast Asia requires around US$210 billion annually until 2030 to meet its climate-resilient infrastructure needs alone.49
Growing the clean energy economy and managing the transition to net zero emissions will require coordinated effort by Australia and its partners regionally and globally. This will present opportunities and have a substantial impact on Australia's economic relationship with Southeast Asia. Eight of the 11 Southeast Asian countries have announced a net zero target.
Australia is already a major source of agricultural and food products for Southeast Asian consumers and is well placed to continue to help the region meet its food security needs. Australia and the region will need to build secure agrifood supply chains that are resilient to biosecurity and climate change risks.
The region is undergoing a rapid and unprecedented digital transformation. According to the Asian Development Bank, by 2030, the digital economies of Southeast Asia are predicted to be worth between US$600 billion and US$1 trillion, up from an estimated US$200 billion in 2022.50 Digital uptake will impact on all areas of economic activity, supporting greater trade in services, particularly education, government and professional services.
Australia's education services are in high demand throughout the region, but maintaining attractiveness as a destination will require ongoing development of offerings and strong marketing. Over the long term, Australia should seek to drive large-scale two-way mobility to deepen professional exchanges and cultural immersion. There is also scope to increase collaboration in the arts, digital games and film development, the live performance industry, and other creative industries.
There is significant potential to grow two-way tourism between Australia and the region. Realising greater two-way tourism potential will require better understanding of cultural needs, tourism product development, marketing and expanded air links. Australia's market share of Southeast Asian tourist travel is much lower than our geographic proximity suggests it should be.
Based on these key trends, this strategy's priority sectors are agriculture and food, resources, green energy transition, infrastructure, education and skills, visitor economy, healthcare, digital economy, professional and financial services, and creative industries.
4 Economic Intelligence Unit (EIU), Data Report to the Department of Foreign Affairs and Trade for the Southeast Asia Economic Strategy, EIU, 2023, unpublished. Note: ranking of ASEAN as fourth largest economy does not account for other regional economic groupings, such as the European Union or Mercosur, for example.
5 Department of Foreign Affairs and Trade calculations based on United Nations, Department of Economic and Social Affairs, Population Division. World Population Prospects 2022 dataset, 2022, accessed 30 June 2023.
6 Austrade analysis based on Euromonitor, Economies and Consumers Data 2022, accessed 26 May 2023.
7 Department of Foreign Affairs and Trade calculation, based on Economic Intelligence Unit, Data report to the Department of Foreign Affairs and Trade for the Southeast Asia Economic Strategy, EIU, 2023, unpublished.
8 Using real GDP US$ millions (2010 prices) compound annual growth rate terms. Department of Foreign Affairs and Trade calculation based on based on Economic Intelligence Unit, Data report to the Department of Foreign Affairs and Trade for the Southeast Asia Economic Strategy, EIU, 2023.
9 Department of Foreign Affairs and Trade calculations based on Economic Intelligence Unit (EIU), Data report to the Department of Foreign Affairs and Trade for the Southeast Asia Economic Strategy, EIU, 2023, unpublished.
10 C Ormiston, Southeast Asia's Pursuit of the Emerging Markets Growth Crown, Bain & Co and Monk's Hill Angsana Council, 2022, accessed 30 June 2023.
11 CY Park and B Yeung, 'An Integrated and Smart ASEAN: Overcoming Adversities and Achieving Sustainable and Inclusive Growth', Asian Development Banking Institute Working Paper No. 1267, May 2021, accessed 23 May 2023, p. 4. Middle class refers to the number of people living in households earning or spending between $10 and $100 per person per day.
12 Department of Foreign Affairs and Trade, Australia's direction of goods and services trade – calendar years dataset, July 2023, accessed 26 July 2023.
13 Department of Foreign Affairs and Trade, Australia's direction of goods and services trade – calendar years dataset, July 2023, accessed 26 July 2023.
14 Department of Foreign Affairs and Trade, Standard International Trade Classification (SITC) pivot table dataset, May 2023, accessed 26 July 2023.
15 Department of Foreign Affairs and Trade (DFAT) calculations based on DFAT, Australia's direction of goods and services trade – calendar years dataset, 2023, accessed 26 July 2023. DFAT calculations based on World Bank, national accounts data dataset, n.d., accessed 26 July 2023.
16 Department of Foreign Affairs and Trade calculations based on Global Trade Atlas. Note: this excludes data for Cambodia, Laos and Vietnam.
17 Department of Foreign Affairs and Trade calculations based on Global Trade Atlas.
18 Department of Foreign Affairs and Trade (DFAT) calculations based on DFAT, Australia's direction of goods and services trade – calendar years, DFAT, Australian Government, 2023, accessed 26 July 2023.
19 Austrade analysis based on Australian Border Force, Customs data, 2021–22 Merchandise Exports [dataset, ABF, unpublished.
20 Austrade analysis based on Australian Border Force, Customs data, 2021–22 Merchandise Exports [dataset, ABF, unpublished.
21 Department of Foreign Affairs and Trade calculations based on Australian Bureau of Statistics (ABS), International Investment Position, Australia: Supplementary Statistics, ABS website, 2022, accessed 26 May 2023.
22 Australian Bureau of Statistics (ABS), International Investment Position, Australia: Supplementary Statistics, ABS website, 2022, accessed 26 May 2023.
23 Department of Foreign Affairs and Trade calculations based on Australian Bureau of Statistics (ABS), International Investment Position, Australia: Supplementary Statistics, ABS website, 2022, accessed 26 May 2023, Table 5.
24 United Nations Conference on Trade and Development, Beyond 20/20 WDS – Foreign direct investment: Inward and outward flows and stock, annual dataset, n.d., accessed 2 June 2023.
25 United Nations Conference on Trade and Development (UNCTAD) and ASEAN Secretariat, ASEAN Investment Report 2022, ASEAN Secretariat, 2022, accessed 24 May 2023. ; UNCTAD, Beyond 20/20 WDS – Foreign direct investment: Inward and outward flows and stock, annual dataset, n.d., accessed 2 June 2023.
26 United Nations Conference on Trade and Development, Beyond 20/20 WDS – Foreign direct investment: Inward and outward flows and stock, annual dataset, n.d., accessed 2 June 2023.
27 Government of Canada, 'Canada-ASEAN trade and Investment', Government of Canada, 2023, accessed 1 June 2023.
28 Australian Bureau of Statistics (ABS), International Investment Position, Australia: Supplementary Statistics, ABS website, 2022, accessed 26 May 2023.
29 United Nations Conference on Trade and Development and ASEAN Secretariat, ASEAN Investment Report 2022, ASEAN Secretariat, Jakarta, 2022, p. 9, accessed 24 May 2023.
30 ASEAN Secretariat, 'Stocks of inward foreign direct investment (FDI) at year-end, by source country (in million US$)' dataset, n.d., accessed 1 June 2023.
31 Data for Timor-Leste's outwards investment unavailable.
32 Australian Bureau of Statistics (ABS), International Investment Position, Australia: Supplementary Statistics, ABS website, 2022, accessed 26 May 2023.
33 Australian Bureau of Statistics (ABS), International Investment Position, Australia: Supplementary Statistics, ABS website, 2022, accessed 26 May 2023.
34 Department of Foreign Affairs and Trade (DFAT), Statistics on who invests in Australia, DFAT, 2022, accessed 2 June 2023.
35 In nominal GDP US$ terms. Department of Foreign Affairs and Trade calculation based on Economic Intelligence Unit (EIU), Data report to the Department of Foreign Affairs and Trade for the Southeast Asia Economic Strategy, EIU, 2023, unpublished.
36 J Hawksworth and H Audino, The World in 2050: The long view: how will the global economic order change by 2050?, PricewaterhouseCoopers, 2017, p. 7, accessed 24 May 2023.
37 In nominal GDP US$ terms. Department of Foreign Affairs and Trade calculation, based on Economic Intelligence Unit (EIU), Data report to the Department of Foreign Affairs and Trade for the Southeast Asia Economic Strategy, EIU, 2023, unpublished. Indonesia: 4.98 per cent; the Philippines: 5.08 per cent; and Vietnam: 4.98 per cent.
38 Compound annual growth rate (CAGR) based on real GDP US$ million (2010 prices). Department of Foreign Affairs and Trade calculation, based on Economic Intelligence Unit (EIU), Data report to the Department of Foreign Affairs and Trade for the Southeast Asia Economic Strategy, EIU, 2023, unpublished.
39 Nomura, 'Anchor Report: Asia's time to shine', Global Markets Research, Nomura, 5 June 2023.
40 Austrade analysis based on Euromonitor, Economies and Consumers Data 2022, accessed 26 May 2023.
41 United Nations, Department of Economic and Social Affairs, Population Division. World Population Prospects 2022, 2022, accessed 24 May 2023.
42 United Nations, Department of Economic and Social Affairs, Population Division. World Population Prospects 2022, 2022, accessed 24 May 2023.
43 United Nations, Department of Economic and Social Affairs, Population Division. World Population Prospects 2022, 2022, accessed 24 May 2023.
44 United Nations, Department of Economic and Social Affairs, Population Division. World Population Prospects 2022, [dataset], 2022, accessed 24 May 2023.
45 International Labour Organization, ILOSTAT database [dataset], 2023, accessed on 23 March 2023.
46 International Labour Organization, ILOSTAT database [dataset], 2023, accessed on 23 March 2023.
47 Workplace Gender Equality Agency, Gender equality workplace statistics at a glance 2022, WGEA, 2021.
48 Economist Intelligence Unit and United Nations Economic and Social Commission for Asia and the Pacific, Key Economic Data, Urban Population as a percentage of population (forecasts).
49 Asian Development Bank, Meeting Asia's Infrastructure Needs, ADB, Manila, 2017, p.43.
50 Asian Development Bank, ‘Southeast Asia’s Digital Economy to Hit $200B in 2022’, Asian Development Bank Southeast Asia Development Solutions website, 27 February 2023, accessed 20 June 2023. Google, Temasek and Bain, e-Conomy SEA 2022, Google, Temasek and Bain, 2022, accessed 30 March 2023.


