
Print version
Australia's Trade and Investment Interests in RCEP Participating Countries [PDF 569 KB]
The Regional Comprehensive Economic Partnership (RCEP) negotiations include the 10 Association of Southeast Asian Nations (ASEAN) Member States and ASEAN's six free trade agreement (FTA) partners – Australia, China, India, Japan, Republic of Korea (ROK) and New Zealand. These countries are important economic partners and neighbours for Australia. RCEP countries include nine of Australia's top 12 trading partners, and cover almost 60 per cent of Australia's two-way trade in goods and services, valued at $392.4billion (see Annex 1).
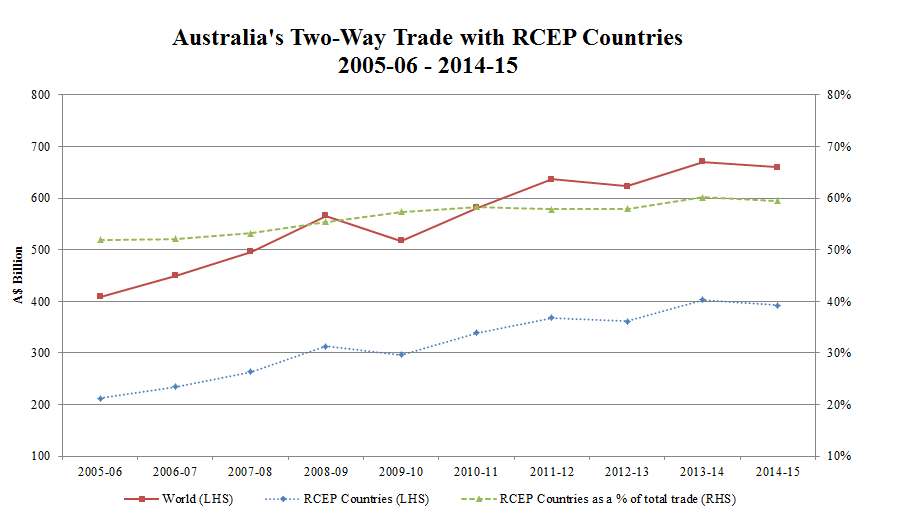
Australia has a broad and diverse range of trade and investment interests in RCEP countries, across all sectors of our economy (agriculture, manufacturing, resources and services). Over the past decade, Australia's trade with RCEP countries has increased significantly, recording annual growth of 10.6 per cent compared with Australia's overall annual growth in two-way trade of 7.8 per cent.
The graph below illustrates this growth, showing RCEP countries' share of Australia's total two-way trade in goods and services increasing from 51.8 per cent in 2005-06 to 59.4 per cent in 2014-15.
Trade in Goods
The progressive elimination of barriers to trade in goods is a key aspect of the Guiding Principles and Objectives for Negotiating the RCEP [PDF] endorsed by Leaders. In 2014, RCEP countries accounted for almost three quarters (75.4 per cent) of Australia's goods exports and 64.4 per cent of two-way trade in goods. Through RCEP, Australia will look to build on the market access commitments already negotiated through existing free trade agreements. Australia will, through RCEP, press for greater liberalisation in regional markets, particularly in the agricultural sector and enhance opportunities to integrate into regional value chains.
Trade in Services
RCEP will seek to remove restrictions and discriminatory measures related to trade in services. In 2014, RCEP countries accounted for almost half (46.9 per cent) of Australia's services exports and 39.9 per cent of two-way trade in services. Through RCEP, Australia will seek to build on the outcomes of existing bilateral and regional agreements, and work towards greater liberalisation of services sectors throughout the region. Given the importance of the services sector to the Australian economy, and the key role that many services play in enabling trade, particularly trade through integrated supply chains, RCEP has considerable potential to support greater engagement of the Australian services sector in the region.
Through RCEP, Australia will seek quality outcomes for a number of services sectors – especially, financial, telecommunications, education, professional, transport, health, mining engineering and technology and agricultural services. These are sectors in which Australia has a strong competitive advantage, which would benefit through greater liberalisation of services in the region.
Investment
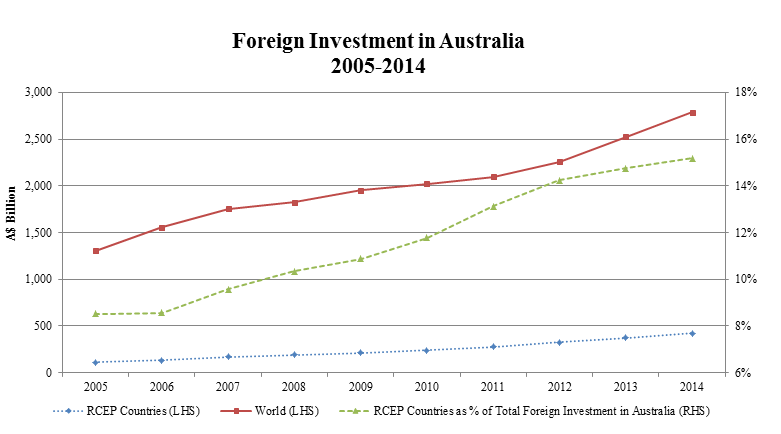
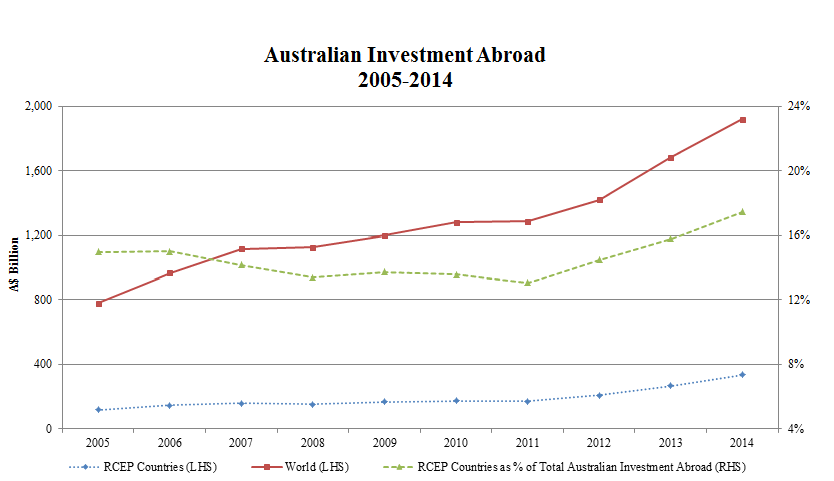
RCEP will aim to create a more liberal and competitive regional investment environment. At present, RCEP countries account for 15.2 per cent of total foreign investment in Australia, valued at $422.7 billion in 2014, and 17.5 per cent of total Australian investment abroad, valued at $335 billion in 2014. Given the strength of Australia's trade relationships in the region, these figures suggest that there is scope to deepen the investment relationship with regional countries through an expansion of investment and broadening of Australian investment across RCEP countries.
Japan, China, Singapore and New Zealand are ranked in Australia's top 10 source countries in terms of foreign investment stock (accounting for nearly 10 per cent of the total). . New Zealand, Japan, Singapore and China are ranked in the top 12 destination countries for Australian investment abroad. However, total Australian investment stocks with RCEP countries over the past 10 years have on the whole hovered between nine and 14 per cent for inward investment and around 14-16 per cent for outward investment.
Investment policy regimes remain uneven in the region, combining a high degree of liberalisation in some sectors with significant interventionist and restrictive policies in other sectors. RCEP will break new ground on investment by including country-specific commitments on foreign investment in manufacturing, agriculture, fisheries, forestry and mining. It is the first time Australia has received offers of such commitments from China and India. None of ASEAN's FTAs, including the ASEAN-Australia-New Zealand FTA, have yet achieved such commitments.
As the graphs below illustrate, Australia's two-way investment relationship with RCEP countries is significantly weaker than two-way trade flows. Australia sees scope to broaden and deepen Australian investment in the region, and regional investment in Australia, to align more closely with the growth in our trade.
Other Issues
The Guiding Principles and Objectives detail additional issues beyond goods, services and investment that RCEP negotiations will address. These include economic and technical cooperation, electronic commerce, intellectual property, competition and dispute settlement. Additionally, the negotiations may consider other issues covered by existing Free Trade Agreements among RCEP countries throughout the course of negotiations.
Annex 1
| Exports (A$bn) | % share | Imports A($bn) | % share | Total (A$bn) | % share | Rank | |
|---|---|---|---|---|---|---|---|
| China | 90.2 | 28.3 | 59.5 | 17.4 | 149.7 | 22.7 | 1 |
| Japan | 46.6 | 14.6 | 21.1 | 6.2 | 67.7 | 10.3 | 2 |
| ROK | 20.5 | 6.4 | 14.3 | 4.2 | 34.8 | 5.3 | 4 |
| Singapore | 12 | 3.8 | 18.8 | 4.8 | 30.8 | 4.7 | 5 |
| New Zealand | 12.4 | 3.9 | 11.3 | 3.3 | 23.7 | 3.6 | 7 |
| Thailand | 6 | 1.9 | 14 | 4.1 | 20 | 3.0 | 8 |
| Malaysia | 7.9 | 2.5 | 11.7 | 3.4 | 19.6 | 3.0 | 9 |
| India | 12.7 | 4 | 5.3 | 1.6 | 18 | 2.7 | 10 |
| Indonesia | 6.9 | 2.2 | 8 | 2.3 | 14.9 | 2.3 | 12 |
| Other ASEAN* | 7.3 | 2.3 | 8.6 | 2.5 | 15.9 | 2.4 | |
| RCEP Total | 222.4 | 69.8 | 170 | 49.8 | 392.4 | 59.5 | |
| World Total | 318.7 | 100 | 341.3 | 100 | 660 | 100 | |
| Notes: totals may not add due to rounding | |||||||
| *Other ASEAN countries: Brunei, Cambodia, Laos, Myanmar, Vietnam and Philippines, | |||||||
| Source: DFAT STARS database and ABS catalogue 5368.0.55.003 & unpublished ABS data. | |||||||
Annex 2
| Total (A$m) | % share | Rank | |
|---|---|---|---|
| Japan | 174,676 | 6.3 | 4 |
| Singapore | 80,207 | 2.9 | 5 |
| China | 64,525 | 2.3 | 7 |
| New Zealand | 38,523 | 1.4 | 12 |
| Republic of Korea | 22,887 | 0.8 | 15 |
| Malaysia | 20,994 | 0.8 | 17 |
| India | 10,981 | 0.4 | 23 |
| Thailand | 6,575 | 0.2 | |
| Indonesia | 1,455 | 0.1 | |
| Other ASEAN** | 2,060 | 0.07 | |
| RCEP Total | 422,664 | 15 | |
| World Total | 2,784,470 | 100 |
* ABS figures can only be ranked as far as top 23 for 2014 because of ABS confidentiality restrictions.
** Other ASEAN includes Brunei, Cambodia, Laos, Myanmar, Philippines and Vietnam.
Annex 3
| Total (A$m) | % share | Rank | |
|---|---|---|---|
| New Zealand | 99,927 | 5.2 | 3 |
| Japan | 69,645 | 3.6 | 4 |
| China | 57,884 | 3.0 | 6 |
| Singapore | 50,715 | 2.6 | 7 |
| Republic of Korea | 15,478 | 0.8 | 16 |
| India | 9,814 | 0.5 | 18 |
| Philippines | 9,619 | 0.5 | 20 |
| Malaysia | 9,604 | 0.5 | 21 |
| Indonesia | 8,126 | 0.4 | 23 |
| Other ASEAN** | 6,170 | 0.3 | |
| RCEP Total | 336,982 | 18 | |
| World Total | 1,918,321 | 100 |
* ABS figures can only be ranked as far as top 30 for 2015 because of ABS confidentiality restrictions.
** Other ASEAN includes Brunei, Cambodia, Laos, Myanmar, Thailand and Vietnam.